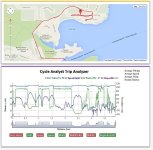
-EDIT- This thread started off for the creating of a stand alone tool to open and view CA trip data inside google earth, but it evolved instead into an online web application that runs inside your browser, with nothing to download and install. This web app is available from here:
http://www.ebikes.ca/tools/trip-analyzer.html
********************************
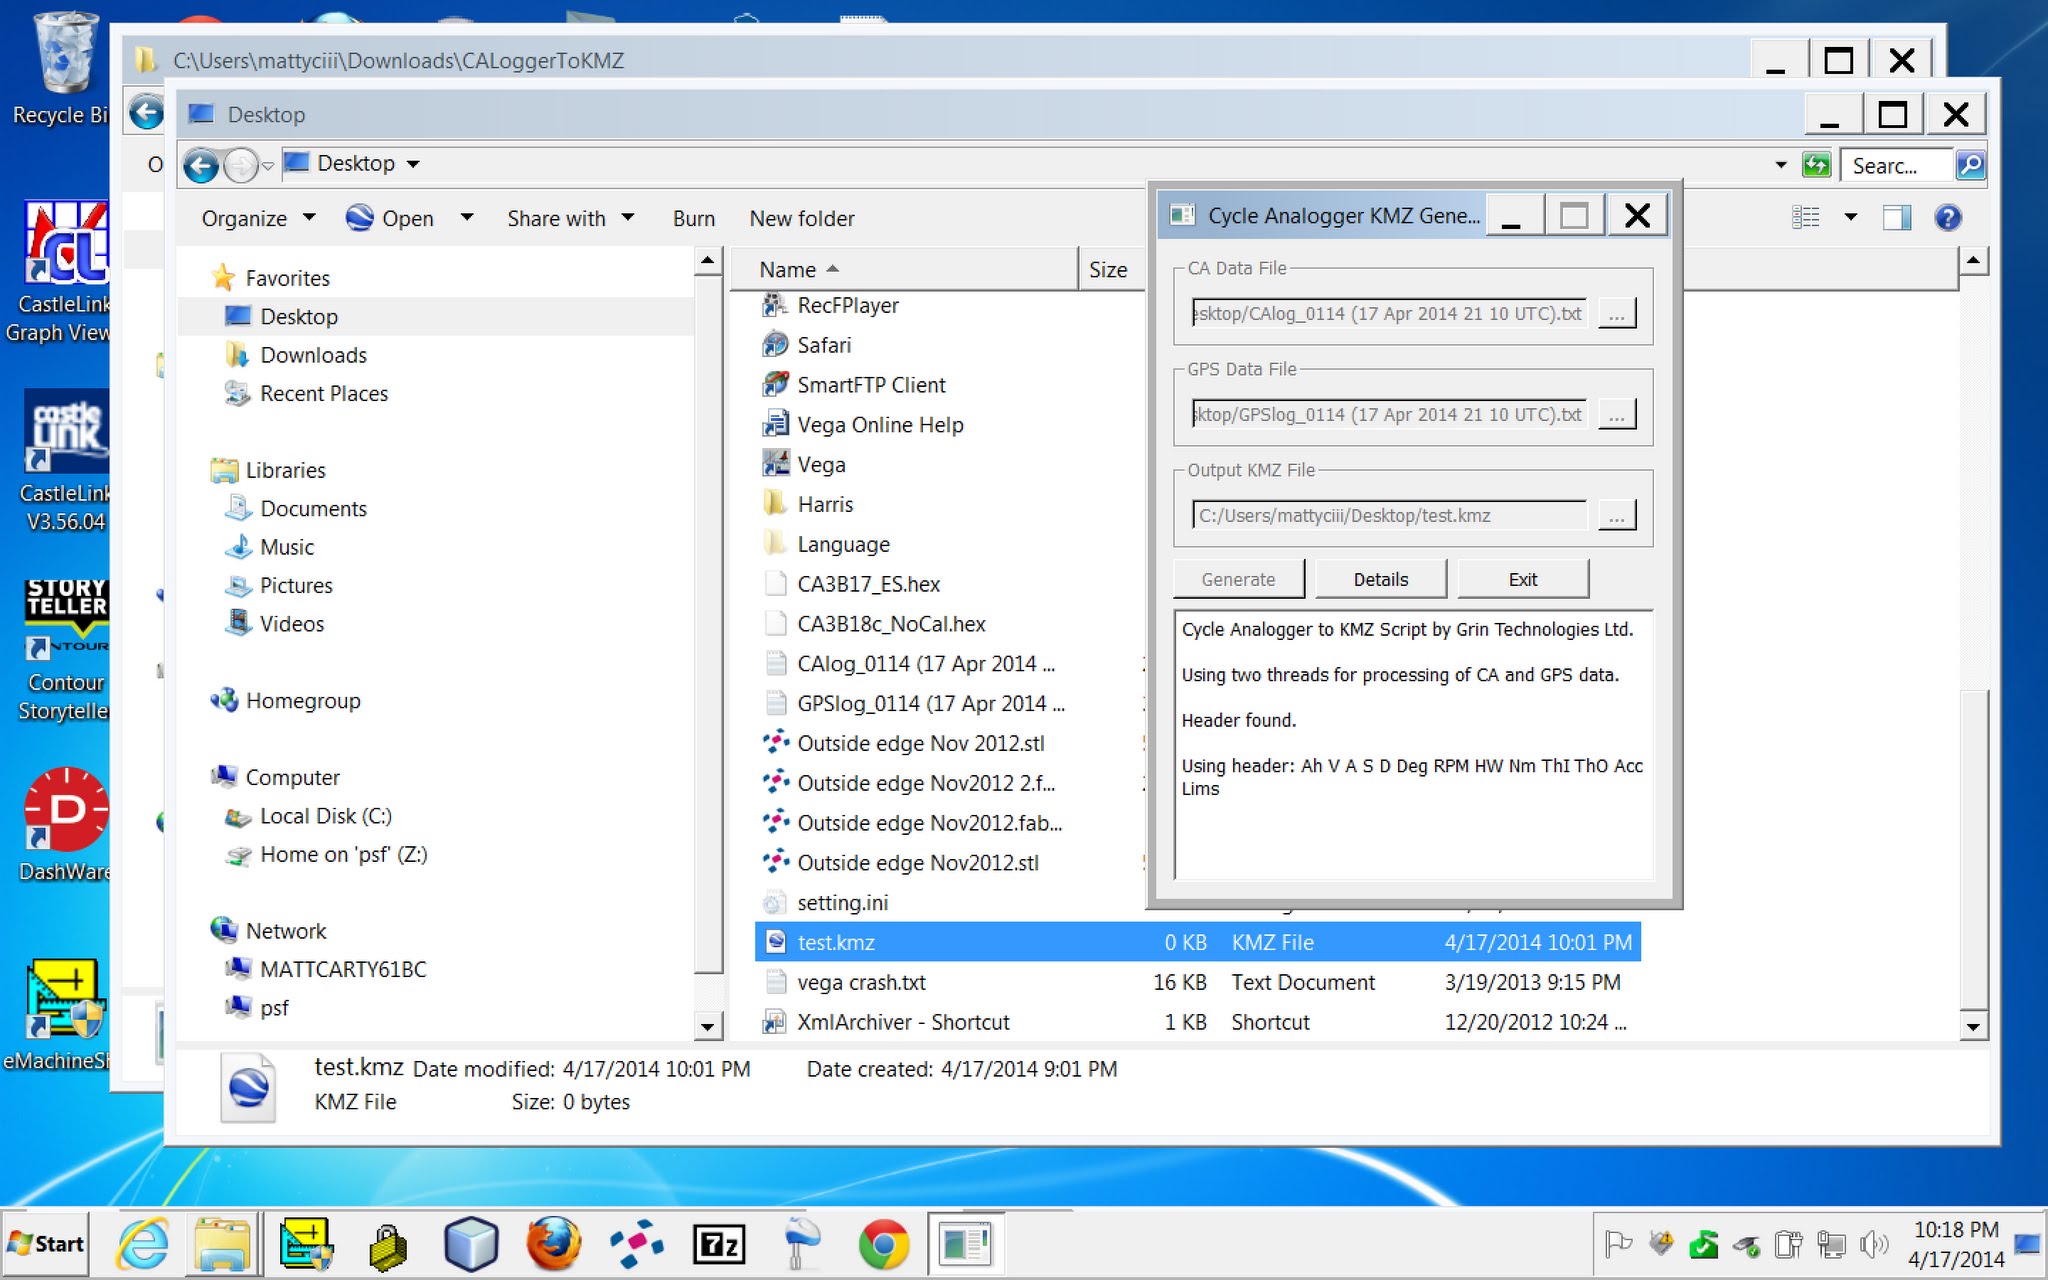
Just a very preliminary release but I thought some people might like to play with this in the current state. Unzip the attached software package and launch the executable, then load both a CA log file and a corresponding GPS file in the file dialogs. If you have a GPS analogger then these files will created and saved with each trip, but you could also have CA data that is logged on a computer and GPS data that comes from any device that saves location data at 1Hz in a NMEA format.
View attachment 5
This will generate a .kmz file, which you can then open with Google Earth. Once you do, it should zoom in to show your trip route, along with a 3D line bar graph for your speed, voltage, current, and watts:
View attachment 2
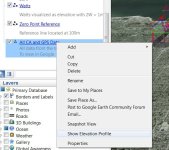
Where it gets fun though is if you right click on the "All CA and GPS Data" in the places sidebar and select the option to show elevation profile:
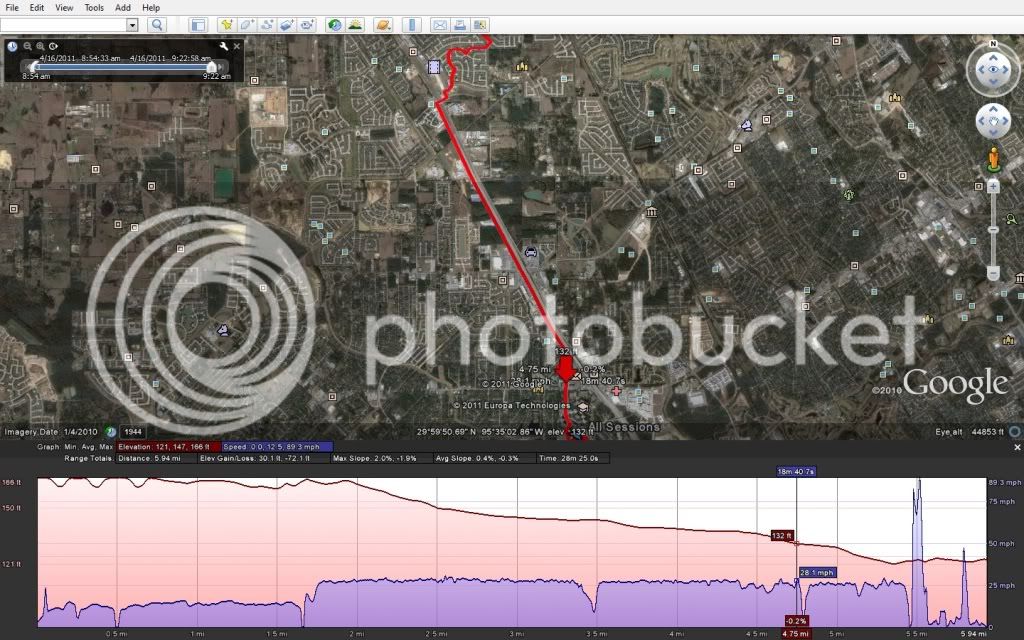
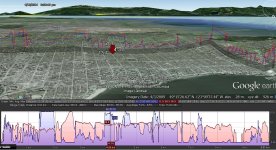
Then you will see a 2D graph appear under the map, along with options to simultaneously show any two of the logged CA parameters. There is a live cursor which you can scroll back and forth to see the numeric data, and which will highlight the corresponding location on the map with a large arrow. Here for instance is this trip above showing the motor amps and vehicle speed:
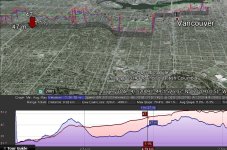
Here is the plot of motor temperature and trip elevation. You can easily see the periods of motor temperature increase corresponding more or less to sections of the trip that involved hill climbs
There's still a lot more work to do but at this point it's at least fairly usable for people who want to play a bit with their ebike data sets, so download and play
http://www.ebikes.ca/tools/trip-analyzer.html
********************************
Just a very preliminary release but I thought some people might like to play with this in the current state. Unzip the attached software package and launch the executable, then load both a CA log file and a corresponding GPS file in the file dialogs. If you have a GPS analogger then these files will created and saved with each trip, but you could also have CA data that is logged on a computer and GPS data that comes from any device that saves location data at 1Hz in a NMEA format.
View attachment 5
This will generate a .kmz file, which you can then open with Google Earth. Once you do, it should zoom in to show your trip route, along with a 3D line bar graph for your speed, voltage, current, and watts:
View attachment 2
Where it gets fun though is if you right click on the "All CA and GPS Data" in the places sidebar and select the option to show elevation profile:

Then you will see a 2D graph appear under the map, along with options to simultaneously show any two of the logged CA parameters. There is a live cursor which you can scroll back and forth to see the numeric data, and which will highlight the corresponding location on the map with a large arrow. Here for instance is this trip above showing the motor amps and vehicle speed:

Here is the plot of motor temperature and trip elevation. You can easily see the periods of motor temperature increase corresponding more or less to sections of the trip that involved hill climbs

There's still a lot more work to do but at this point it's at least fairly usable for people who want to play a bit with their ebike data sets, so download and play


