How to read cryptic motor graph?

Joined
Jun 20, 2015
Messages
407
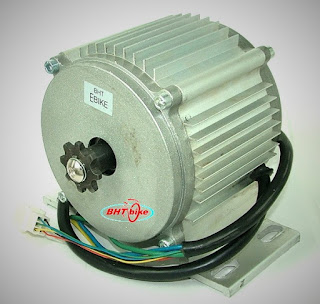
has anyone seen another motor like the BHT ; it operated at about 1550 rpm unless the graph was wrong??
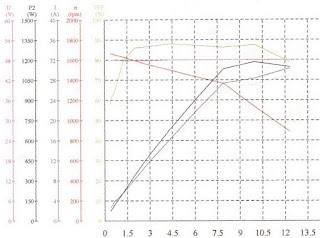
no longer in production...so now I am trying to understand the grintech graphs.....but I cannot find anything that spells out how to read it.


http://e-bike-diffusion.com/index.p...ategorie%26code_cat%3D24%26page_start_num%3D1


BHT-BDLC%2B48v%2B1000w.jpg


https://endless-sphere.com/forums/viewtopic.php?f=28&t=57483

BHT%2Bchart.JPG
 
I calculated that I need a 13 mph gear at the wattage I can afford, for climbing my worst hill with the weight I may haul up it. If I want to gear my setup to run that speed at that load, full throttle. How can I tell if I am reading these graphs correctly?


I have figured out that to use an efectively smaller wheel on the 26" wheeled bike, I should just build a gear reduction of 1.3 : 1 for this graph. and a 1.6 : 1 for the 16" wheel, and mount the motor under the seat.

https://4.bp.blogspot.com/-X4exD9_o...TUeFA3G4SACLcB/s1600/clytet+4080+20+wheel.JPG


clyte%2B4080%2B16%2Bwheel.JPG
 
Hugh-Jassman said:
Ok I see how to use the “load line” now “Load - the power required to perform the work indicated by the graph. Generally this should be very close to the value "Motor Power": https://kinayems.com/Support/EbikeSystemSimulator
That doesn't really make any sense. The entire red line is motor power...

The Load Line is explained on the Simulator page. Here's an alternate explanation:


  • The black Load Line shows the power required to propel the configured bike at any speed. This has nothing to do with the simulator - it reflects the same results you get from any standard bike speed calculator - basic physics - nothing to do with motors. This is all about aero drag, rolling coef, grade, etc.

    The red line is the mechanical power the motor can deliver at any speed where speed varies according to load not throttle. This is based on dyno data and Justin's modeling - this is the 'simulation' part and has nothing to do with drag, grade, etc.

    The intersection of these two lines is the point where the power to propel the bike is exactly equal to the power produced by the motor. This indicates the terminal speed for that bike configuration and load. This is simply a graphic solution to two separate sets of power equations (i.e. it could be done algebraically - the graphic solution is equally valid...)
This means that if you want know how much power it takes to push your bike to 35mph, you just turn off all the lines except the Load Line, configure the bike, then look at the power at 35mph... This is the amount of power required regardless of the motor or drive system. It's only when you play this curve against a specific motor that you get into the terminal speed, etc where the specifics of that motor/batter/controller can be balanced against the requirements of the bike/grade/etc.

For example, in your plot above, we see that it takes about 3200W (motor power) to push that bike to 45mph. Using the same efficiency as shown (86.9%) we see that although it takes about 2680W (battery power) to achieve 40mph, it would require 3200/.869 = 3680W (battery power) to get to 45mph - a fairly staggering increase for 5mph - but perfectly understandable when you look at the steepness of the Load Line at that speed.
 
This is other part of what they said (the seattle people said on their site):

Pay close attention to the Motor Power Curve (Red Line) and the Black Curve (Load Line). Typically the Motor power curve will rise up in an arc, and then abruptly fall off on a straight line down to "0" The highest point (Apex) of the motor power curve is when the motor is demanding the full current output of the controller (and where it is least efficient).

If the Load line intersects to the right of the apex of the motor power curve, then the controller is powerful enough for the system. If the load line intersect the motor power curve to the left of the apex of the motor power curve, then the controller is too small, and we should look for a more powerful (higher current) controller.
 
Will this show me at least the motor's heat limits?:

Set the simulator's parameters and 'load line' to see if the grade I want to climb is close to the peak, then do the 'grade and speed' which turns off the throttle value; then Slide the cursor back to the point where the load line intersected the red power line and read the grade and the heat indicator time on the data list. Slide it back farther to see what grade it can climb while keeping it near the efficiency peak.

What will happen if I climb a much steeper grade than the motor is capable of? Will the motor stall out? How can I determine the maximum grade on the graph??

should I be lookiing at the where the power line crosses the torque line?


This has all the answers:
http://www.ebikes.ca/learn/power-ratings.html
 
Back
Top