
Doctorbass
100 GW
I think this is very important for people to know what is the influence of playing with different charge voltage for lithium cells.
Here is an exemple of typical lithium ion statistic:
Usable Capacity vs charging voltage
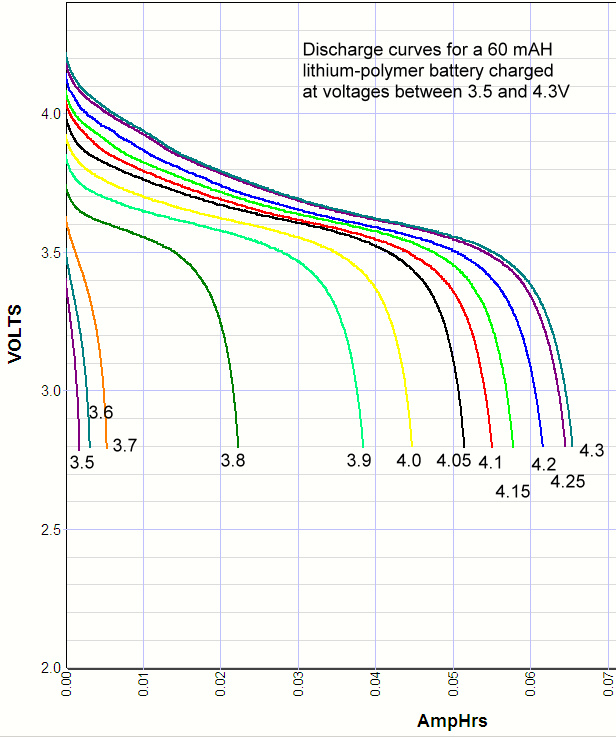
Summary of tests, see discharge curves below
Charge voltage
3.3V 3.5V 3.6V 3.7V 3.8V 3.9V 4.0V 4.05V 4.1V 4.15V 4.2V 4.25V* 4.3V*
Pecentage of 4.2V capacity
0% 2.9% 5.0% 8.6% 36% 62% 73% 83% 89% 94% 100% 105% 106%
Percentage of rated capacity
0% 3% 5.2% 8.8% 37% 63% 75% 86% 92% 96% 103% 108% 109%
Cycle life vs charging voltage:
The cell phone industry did a study looking at the effects of ending
charge voltage on cycle life.
Under laboratory conditions, and with an 80% depth of discharge,
terminating the charge
at 4.1 volts, you get over 2000 cycles.
at 4.2 volts, you get roughly 500 cycles.
at 4.3 volts, you get under 100 cycles.
at 4.4 volts, you get less than 5 cycles.
The RC people have seen similar results, and one test that is ongoing
is at roughly 800 cycles with a charge termination of 4.15 volts. This
seems to be the sweet spot for performance and cycle life.
In normal use, you can extend the life of your battery by limiting the
maximum charge to below 4.2 volts, and limiting the depth of
discharge.
REMAINING CAPACITY
When testing OCV...heres a reasonably accurate capacity to voltage
converter [voltage under 550ma load]
100% 4.20V
90% 3.97V
80% 3.87V
70% 3.79V
60% 3.73V
50% 3.68V
40% 3.65V
30% 3.62V
20% 3.58V
10% 3.51V
05% 3.42V
00% 3.00V
below 3V is recoverable....but generally not recommended
Source : http://www.powerstream.com
Doc
Here is an exemple of typical lithium ion statistic:
Usable Capacity vs charging voltage
Summary of tests, see discharge curves below
Charge voltage
3.3V 3.5V 3.6V 3.7V 3.8V 3.9V 4.0V 4.05V 4.1V 4.15V 4.2V 4.25V* 4.3V*
Pecentage of 4.2V capacity
0% 2.9% 5.0% 8.6% 36% 62% 73% 83% 89% 94% 100% 105% 106%
Percentage of rated capacity
0% 3% 5.2% 8.8% 37% 63% 75% 86% 92% 96% 103% 108% 109%
Cycle life vs charging voltage:
The cell phone industry did a study looking at the effects of ending
charge voltage on cycle life.
Under laboratory conditions, and with an 80% depth of discharge,
terminating the charge
at 4.1 volts, you get over 2000 cycles.
at 4.2 volts, you get roughly 500 cycles.
at 4.3 volts, you get under 100 cycles.
at 4.4 volts, you get less than 5 cycles.
The RC people have seen similar results, and one test that is ongoing
is at roughly 800 cycles with a charge termination of 4.15 volts. This
seems to be the sweet spot for performance and cycle life.
In normal use, you can extend the life of your battery by limiting the
maximum charge to below 4.2 volts, and limiting the depth of
discharge.
REMAINING CAPACITY
When testing OCV...heres a reasonably accurate capacity to voltage
converter [voltage under 550ma load]
100% 4.20V
90% 3.97V
80% 3.87V
70% 3.79V
60% 3.73V
50% 3.68V
40% 3.65V
30% 3.62V
20% 3.58V
10% 3.51V
05% 3.42V
00% 3.00V
below 3V is recoverable....but generally not recommended
Source : http://www.powerstream.com
Doc