Preview of version 2 of the hub motor / ebike simulator

justin_le

Administrator
Staff member
Joined
May 28, 2007
Messages
2,299
Location
Vancouver
Hey guys, we're finally getting around to some very long overdue updates to the simulator at ebikes.ca. It's now more than just a hub motor simulator, but an overall vehicle simulation tool which was always the intent. We are still working out the cosmetic layout details so the placement of the various controls is still being sorted, but the functionality is there:

Screen Capture for ES.gif
http://www.ebikes.ca/simulator3-2/

Click the link above and GO NUTS


Updates in a nutshell:
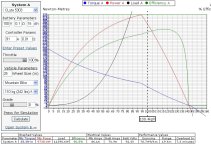
  • Shows the load curve of a bicycle on the same graph as the power output of the hub
  • Optionally, directly show the %grade hill that the system will climb as a function of speed
  • Compare side-by-side two systems (A and B) on the same chart
  • Vertical cursor bar, click anywhere on the graph and see the exact performance stats at that point
  • Shows the estimate range you could get at a particular speed based
  • Show the wh/km, motor phase current, terminal battery voltage, etc. at that speed
  • Show the estimated time before motor overheats

The motor overheat time is quite conservative now as it is based on destructive thermal testing I did on the hubs in a static situation on a lab bench, without the motor spinning or exposed to ambient air flow as it would on a bicycle. A more comprehensive model is on the agenda but those are seriously involved experiments to setup and run, so who knows if there will ever be time.
Even as is though, the value still does give a relative idea of how sensible a particular motor / controller combo is. If it says the motor will overheat in 3 minutes at your expected cruising speed, you probably know it's not a smart setup.

Anyways, as always constructive feedback is appreciated. We're looking to finalize this in the next couple days and then go live with it. -Justin
 
Wow this update has taken the simulator to a whole new level :shock:

Amazing work as usual! Even in the ten minutes I've been playing with it, the simulator has proved some things I thought to be true, false!
For instance I was messing around with the weights to see how much speed I'd lose by carrying my heavy charging system with me on rides, turns out 5kg extra only loses me 0.2Kph :D

This is just awesome, I could (and probably will) fiddle with it for hours in the name of optimisation :mrgreen:

Thank you.
 
great work justin

love the "overheat in" option. is your heating equation exponentially based? as in, as heat goes up, so does resistance in the windings? just curious, how one would estimate the heat shedding capability of a motor, sounds interesting. are your limits based on that of the magnets? and does it take into account any kind of air flow?

it would be nice if you could add all the other variables for load like frontal area, Cd, density of air, and rolling resistance. i know your bike selection probably does a lot of that, but another "enter custom values" would be nice.

it also seems like this could be pretty easily adapted to a system that uses gears. like, this graph, represents the 1:1 ratio. it seems like you could just break the x axis into segments (in the applet, you could just have horizontal sliders for each gear change point, and vertical sliders for the new tooth count), then just plot the motor values based on the new rpm (by dividing velocity based rpm, by the gear ratio?).

i'd love to see it graph acceleration too (just add a y axis component of seconds).

it might also be interesting to be able to add to power output with a value for a pedalling contribution.

my spreadsheet just puts a watts required formula in a single row. then each row begins with the distance of a leg, and the new altitude, which then calculates grade (i can totally envision just importing a google earth elevation kml, if you could figure out how to "smooth it out", in a "best fit" kind of way). works pretty well for finding a total wattage for a trip with different grades, but it's just an at the wheels requirement. love how yours incorporates efficiency. that's probably the fatal flaw in mine. and another problem with mine is you have to manually enter velocity. i can't get goal seek to refresh with the change of a relevant cell, or even get it to use a cell for a target value. could be open office isn't able to. so i need to figure out how to solve for the reverse (speed, from watts).

lastly, do you have a spreadsheet version of this, that we could play with? it would be nice to change a value and not have to hit recalculate. it would also make it really easy to toggle between two settings using undo and redo.
 
You're my hero. :lol:


"Overheat in" is a genius idea. That gives a good rule of thumb for people considering high-performance setups!

I absolutely love the slider! And Range values! This would be cool to someday incorporate into the CA software.... :shock:

Thanks!
 
nicobie said:
On the Clyte H series motors, did you test a 35mm stator or by chance was it one of the 30mm ones that came out first?

It's the 35mm model, hence the Hx35.. in the name. I do have one of the 30mm motors that Methods got which I had been meaning to dyno test and get on the simulator database too, but haven't had a chance to get around to it yet. If I do we'll list that on the site as Hx30xx motor so you could tell the difference.

-Justin
 
This is a great aesthetic and functional UI improvement - much more intuitive now. There is one small suggestion I think might be an issue - the range function seems to be a bit off. As I move the performance line to the right the economy decreases (as expected) but for some reason the range continues to climb until it hits flat and goes negative.
 
This is really nice. Thank you.

Any reason why it's slow though? Pretty much have to do -10% grade to get an accurate speed prediction, and even then it's a bit slower than it should be.

Besides minor "beta" issues, it looks to be like the next great thing for ebikes!
 
ptd said:
great work justin

Thanks, actually most of the hard work was done by Michael at our shop who's taken over software stuff and put in a lot of late nights and long days over the past 2 weeks to get all done. So thanks Mike!

love the "overheat in" option. is your heating equation exponentially based? as in, as heat goes up, so does resistance in the windings? just curious, how one would estimate the heat shedding capability of a motor, sounds interesting.

No, in this case I have the resistance of the windings in all cases fixed to about 120% of the room temperature resistance, and so the power dissipated by the hub is based on this rather than a time increasing resistance.

The motor is also modeled just as a single mass with thermal resistance to ambient. To be more precise I would to treat the stator as one lumped mass, with a convective thermal resistance to the rotor and motor shell which would be the 2nd mass, and finally from there the heat dissipates to ambient. With that model under very high loads the stator would overheat even faster, since the heat capacity of the motor shell wouldn't have time to come into play.

But for now it's good enough give a decent qualitative idea of how realistic a system is.

are your limits based on that of the magnets?

No, I chose an arbitrary temperature of 150oC as the point that I considered a motor 'overheated'. That's below the point where the magnets or winding insulation would typically get permanently damaged, but not by much.

and does it take into account any kind of air flow?

As mentioned in the first post, it's based on measured data from static bench tests with no motor rotation or air flow to ambient.

it would be nice if you could add all the other variables for load like frontal area, Cd, density of air, and rolling resistance. i know your bike selection probably does a lot of that, but another "enter custom values" would be nice.

Indeed, that is one of the things we're working on. The plan is to have a base option at the bottom of each dropdown menu where you can select "custom", and then via a pop-up window enter the specific model parameters. The way it's done now (forcing all fields to require custom parameters) is rather clutzy.

For the drop down bike choices I have now, I used parameters that exaggerate the difference between the bike types a bit, so the mountain bike is in like a full upgright posture with large knobby 30 PSI tires, while the full recumbent is assuming a faired and super streamlines vehicle etc. We'll be updating this to have a wider spread of bicycle types to choose from soon.

it also seems like this could be pretty easily adapted to a system that uses gears. like, this graph, represents the 1:1 ratio. it seems like you could just break the x axis into segments (in the applet, you could just have horizontal sliders for each gear change point, and vertical sliders for the new tooth count), then just plot the motor values based on the new rpm (by dividing velocity based rpm, by the gear ratio?).

You can do that very easily by selecting a custom effective wheel diameter.

i'd love to see it graph acceleration too (just add a y axis component of seconds).
it might also be interesting to be able to add to power output with a value for a pedalling contribution.

A better way of visualizing pedal contribution, or the difference between the motor power curve and the load curve, is something we are working on. Acceleration would be pretty easy to do too, but before that we'd need a way of selecting and deselecting what charts to show. Actually, on further thought it wouldn't be too confusing to add it as one more option for the blue chart, so you can choose between motor torque, motor thrust, or acceleration.

lastly, do you have a spreadsheet version of this, that we could play with?
Unfortunately the motor model with winding inductance properly factored in doesn't lend itself to spreadsheet representation very easily. There isn't a closed form solution for a trapezoidal drive motor being switched at the commutation frequency, so the motor characteristics need numeric solvers.

it would also make it really easy to toggle between two settings using undo and redo.
The system A and system B comparison in the current implementation should help with that too, and lets you see the effect of a setting change simultaneously.

Justin
 
Lumumba said:
This is a great aesthetic and functional UI improvement - much more intuitive now. There is one small suggestion I think might be an issue - the range function seems to be a bit off. As I move the performance line to the right the economy decreases (as expected) but for some reason the range continues to climb until it hits flat and goes negative.

Hmm, good point, economy is totally the wrong word for Wh/km. It's the inverse of economy, so we should change the heading to "consumption" perhaps. Indeed at higher speeds for the same throttle setting you will get MORE range and consume less watt-hours per km, so all of that is correct. It means that you are loading the motor less, and typically that's because you are pedaling harder or going down a hill.

If you want to see how your range increases by going slower via backing off the throttle, then look just at the default cursor bar location values (where the load curve crosses the motor output power curve), don't move the cursor back and forth. Then, move the throttle slider down to a lower percentage and hit recalculate. The cursor will now be at a lower speed, and your expected range at this lower speed will be higher.

Good catch on the negative range, we shall take care of with an infinity and beyond symbol.

Justin
 
auraslip said:
This is really nice. Thank you.

Any reason why it's slow though? Pretty much have to do -10% grade to get an accurate speed prediction, and even then it's a bit slower than it should be.
There isn't anything slow unless you are choosing wrong parameters from the drop down. Tell me what setup you are trying to model and what you've actually selected in the simulator and I'll tell you where the mistake is.

Justin
 
Wow, very nice responses.

52v ping, and 9x7 should get to 28mph without speed 120% (that'd be a nice thing to have modeled as well) and not 25mph.

I think the issue is from the predicted load; in reality the mountain bike setting is more of a worse case scenario and the tucked road bike is the best case. It's a bit confusing.
 
Also - I'm assuming time to overheat is based on MTR power and not load? As in, it assumes you're pulling max power at that speed? Which kinda makes it hard to use to figure how long you can cruise along at a slower speed.
 
auraslip said:
Also - I'm assuming time to overheat is based on MTR power and not load?

Yes, for sure.

As in, it assumes you're pulling max power at that speed? Which kinda makes it hard to use to figure how long you can cruise along at a slower speed.

No, all you need to do if you want to see behaviours at a slower cruising speed is to slide the throttle slider down to a point where the power output intercepts the load line your desired slower velocity. It seems that the throttle slider is usually overlooked by most people playing with the simulator, so maybe we should make it a bit more pronounced.

Re: the 9x7 speeds, indeed that is just that the load line for mtb is really worst case, as I said a more realistic value with pressurized tires and road slicks is somewhere between what shows and the 'race tuck' option. As well, the exact wheel circumference plays a bit of a roll, whether you have 26x1.0 or 26x2.5 tires has an appreciable effect if you are just comparing difference of a couple mph.

-Justin
 
theres a throttle slider :oops: :oops: .

thanks justin.
 
Hello Justin,

Thanks for your great work Justin, this new simulator features will certainly be appreciated !

I thought maybe my own Mad Max data could help to get a more and more acurate value on wider dynamic range of speed :wink:

I evaluated the performances of my actual Giant Dh ebike.

The one that can easy do 100kmh between 0% to 80% of dod and 112kmh max speed from 0 to 2% dod

My measured data with cycle analyst and as well calibrated shunt and CA value the best as i can give me an electrical power consumption of 7500Watts at 100kmh continuous.

The motor with some drilled holes o both side cover can keep under 120 celsius constant and stable winding temp ( the snesor is glued inside the winding directly.)

Here are the data for my setup.

-Bicycle: Giant down hill DH 2003 ( full suspension DH bike)
-Wheel: rim for 24" but with 24 x 2.5 Maxxis hookwork tire making overall diameter of 25inch. ( or 12.5 inch when i am on the on the ebike)
-Motor: old gen 5303 with 33mm stator
-Battery 24s lipo 15Ah capable of 20C.. have around 100 cycles on them now
- controller : Kelly 120V 220A ( motor phase amp) ( actually set to 75% max current and 75% max rated phase current).. but the CA measure peal of 232A at around 30% top speed during acceleration
- I weight 150 pounds and measure 5'9"

http://www.evalbum.com/3406

Max recorded GPS speed 112kmh lipo was at 4.20V each cells
Average max GPS speed 106kmh lipo at charged at 4.15V

Acceleration timeél around 0.8sec for each 10km/h increase tested at up to 70kmh.. than i have nor measured over that speed.

But Hey, Justin. I have the GPS analogger!.. so i'll send you the data of some aceleration tests :mrgreen:

What i can not understand is why the new simulator load curve does realy not correspond to the actual measured value i have at 100km/h

The simulator value at 100kmh say 11400 watts and my own measured value are 7500 watts. That's 35% error.

Are the value of the black curve the power at a stabilized speed or while accelerating?é.. Because according to the performances value, i guess it's during accelreration beause at 20kmh at wot the Wh value are 393 Wh per km :shock:

Also, why i can't enter 100A in the custom the current value and why tyhe graph dissapear if i enter 100A but dont at 90A?

Also the watt and efficiency scale dissapear at those 90 and 100A current.. is it fixable?

Doc
 

Attachments

  • Doc 112kmh ebike setup.JPG
    Doc 112kmh ebike setup.JPG
    102.2 KB · Views: 4,274
Thanks again Justin. The simulators have always been a bit lacking instructions on how to use them. By it's very nature it prefers sophistication, rather than a dumbed down product. Which is good, but not for people like me who don't think to use the throttle slider :oops:

I was thinking maybe you made it slower on purpose so politicians wouldn't play with it and go, "Damn. A stock kit can go nearly 30mph? Time to ban them!"
 
Justin, great tool and great responses to questions! I too would be interested in the HS30xx data. Thanks again for all you do and have done! I love the side by side comparison ability.
 
Justin, What an improvement from the old simulator, from my real life test the simulator gave me exactly the same results. WoW!
Now i can accurately predict what my next ebike hub motor and battery combo will give me, no more guessing.
Thanks to you and everyone involved.
 
Hi Thanks so much for this!

I have one question the economy tab seems to be calculated based on the motor amps and not the battery amps as the values seem much higher than I experience in real life. I think the motor amps can climb but the controller reduces the voltage. Also could the grade adjustability be increased? I have grades up to 24% in Nelson.

Thanks

Darrin
 
Really great. Shows so well why certian things happen. Put in a 9c 2807, 48v, 20 amps controller, and 10% grade, and the efficiency number shows exactly why you need to be pedaling hard about then. At 11 mph, the motor is making half the watts into heat.

And the simulator really does predict just about what I see in a real hill climb. Very nice tool to have now.

I would sure like to see a few other windings of the 9c in there though. Since I'm so stoked on the slow windings for dirt riding.
 
Back
Top