
True story: a company fitted VFDs to the air circulation blowers on a gas-fired industrial oven to reduce electricity consumption, save money and also, maybe, save the polar bears. The contractor failed to set the overload properly and one blower tripped out. Someone else had failed to maintain the safety cutout so the oven didn't shut off and a hot spot formed. Yet another person had failed to keep the oven clean and a large buildup of flammable paint residue caught fire. What resulted was equipment damage, lost production, a flurry of finger-pointing and threats of legal action that came to nothing. I learnt a valuable lesson though: VFDS DON'T WORK AND REDUCING ENERGY CONSUMPTION IS DANGEROUS!!!
You are using an out of date browser. It may not display this or other websites correctly.
You should upgrade or use an alternative browser.
You should upgrade or use an alternative browser.
Wind and Solar vs Coal, Gasoline, Nuclear
- Thread starter Hillhater
- Start date
Ianhill
1 MW
- Joined
- Sep 25, 2015
- Messages
- 2,871
Punx0r said:True story: a company fitted VFDs to the air circulation blowers on a gas-fired industrial oven to reduce electricity consumption, save money and also, maybe, save the polar bears. The contractor failed to set the overload properly and one blower tripped out. Someone else had failed to maintain the safety cutout so the oven didn't shut off and a hot spot formed. Yet another person had failed to keep the oven clean and a large buildup of flammable paint residue caught fire. What resulted was equipment damage, lost production, a flurry of finger-pointing and threats of legal action that came to nothing. I learnt a valuable lesson though: VFDS DON'T WORK AND REDUCING ENERGY CONSUMPTION IS DANGEROUS!!!
In the event of an electrical failure please insure the item is clean.
Maybe my ocd does have it's merits, I draw the line at aligning screw heads though that one pisses me off, torque the screw till tight not straight.
TheBeastie
1 MW
New article here on Bill Gates TerraPower technology, this stuff is a while off but it really seems like Bill's dream of fully automated nuclear near-zero waste power-stations that run for decades buried underground that are cheaper than even coal generation is his goal.
Inside the lab where Bill Gates’ TerraPower is inventing the future of nuclear energy
https://www.geekwire.com/2019/inside-terrapower-nuclear-lab/
One of those technologies is known as TWR, which stands for traveling wave reactors. Rather than relying exclusively on enriched uranium, traveling wave reactors are designed to make use of depleted uranium – the waste that’s left over at enrichment plants – as its reload fuel. After starting with enriched uranium, the reactors can continue to run on depleted uranium for decades. It does this by converting the depleted uranium and then using it in one swing through the reactor.
There is also a YouTube video in the article above that I have embedded here for your super convenience.
[youtube]k8K_uM1ilm0[/youtube]
https://www.opg.com/media_release/nanticoke-powerhouse-safety-demolished/
https://www.insauga.com/the-4-sisters-and-their-demolition
https://www.cnn.com/2019/08/16/business/mulheim-karlich-nuclear-power-plant-demolition-grm-intl/index.html
https://www.cp24.com/news/must-watch-nanticoke-generating-station-reduced-to-pile-of-rubble-1.4560454AUGUST 22, 2019
Nanticoke – Today, Ontario Power Generation (OPG) safely demolished the powerhouse of the former Nanticoke Generating Station (GS), which was at one time the largest coal-fired plant in the world. The site on the north shore of Lake Erie has been transformed into OPG’s first-ever solar facility.
https://www.insauga.com/the-4-sisters-and-their-demolition
https://www.cnn.com/2019/08/16/business/mulheim-karlich-nuclear-power-plant-demolition-grm-intl/index.html
sendler2112
100 kW
"The Lakeview Generating Station supplied power to the province of Ontario from 1962 to 2005. It generated more than 215 billion kWh of electricity in its 43 years of operation."
.
Keep in mind that they have demolished 4.000 MW of generating capacity. And in it's place now stands 44MW name plate capacity of solar. Which will actually have a capacity factor of 15% in it's snowy location. So will only average 6.6MW. 0.17% of it's former output. With many days near zero in the winter.
.
This is where we are headed. Things will be much smaller and simpler once again in the future. Simplify now and beat the rush.
.
"The Nanticoke Generating Station is a 44 MW solar power station which started operation in April 2019.[2] Previously from 1972 to 2013, it was the largest coal-fired power plant in North America. At full capacity, it could provide 3,964 MW of power into the southern Ontario power grid from its base in Nanticoke, Ontario, Canada,"
.
https://en.wikipedia.org/wiki/Nanticoke_Generating_Station
.
.
Keep in mind that they have demolished 4.000 MW of generating capacity. And in it's place now stands 44MW name plate capacity of solar. Which will actually have a capacity factor of 15% in it's snowy location. So will only average 6.6MW. 0.17% of it's former output. With many days near zero in the winter.
.
This is where we are headed. Things will be much smaller and simpler once again in the future. Simplify now and beat the rush.
.
"The Nanticoke Generating Station is a 44 MW solar power station which started operation in April 2019.[2] Previously from 1972 to 2013, it was the largest coal-fired power plant in North America. At full capacity, it could provide 3,964 MW of power into the southern Ontario power grid from its base in Nanticoke, Ontario, Canada,"
.
https://en.wikipedia.org/wiki/Nanticoke_Generating_Station
.
sendler2112 said:"The Lakeview Generating Station supplied power to the province of Ontario from 1962 to 2005. It generated more than 215 billion kWh of electricity in its 43 years of operation."
.
Keep in mind that they have demolished 4.000 MW of generating capacity. And in it's place now stands 44MW name plate capacity of solar. Which will actually have a capacity factor of 15% in it's snowy location. So will only average 6.6MW. 0.17% of it's former output. With many days near zero in the winter.
.
This is where we are headed. Things will be much smaller and simpler once again in the future. Simplify now and beat the rush.
.
"The Nanticoke Generating Station is a 44 MW solar power station which started operation in April 2019.[2] Previously from 1972 to 2013, it was the largest coal-fired power plant in North America. At full capacity, it could provide 3,964 MW of power into the southern Ontario power grid from its base in Nanticoke, Ontario, Canada,"
.
https://en.wikipedia.org/wiki/Nanticoke_Generating_Station
.
Most of the power engineers in my program went to Nanticoke. I actually applied for a job there and was offered one but didn't accept it because they wouldn't give us steam time to move up a class. I'm glad I didn't. I ended up on the receiving end, processing the tar from Nanticoke into naphthalene, light and heavy oil, pitch, creosote etc. The whole industry is filthy and I'm glad to see it go. Those solar panels are hiding a multitude of sins.
Hillhater
100 TW
I dont know how far off Bill s technology is, But the Chinese are commissioning 2 Thorium salt reactors/ power generation stations in the Gobi desert as we speak, and as with all things Chinese,...they have roll out plans for many more !TheBeastie said:New article here on Bill Gates TerraPower technology, this stuff is a while off but it really seems like Bill's dream of fully automated nuclear near-zero waste power-stations that run for decades buried underground that are cheaper than even coal generation is his goal.
https://www.scmp.com/economy/china-economy/article/3021912/chinas-showcase-5g-dominance-response-us-tech-war-flagship
Great. I fully support that goal. In the meantime, I also support your right to pay 50-100% more for nuclear power. I will stick to my solar.TheBeastie said:New article here on Bill Gates TerraPower technology, this stuff is a while off but it really seems like Bill's dream of fully automated nuclear near-zero waste power-stations that run for decades buried underground that are cheaper than even coal generation is his goal.
sendler2112
100 kW
billvon said:Great. I fully support that goal. In the meantime, I also support your right to pay 50-100% more for nuclear power. I will stick to my solar.
What is it worth to have electricity in the Winter?
It is worth quite a lot. If you want nuclear power for that, I am all for it. I am also all for the people who want it paying more for it.sendler2112 said:What is it worth to have electricity in the Winter?
Hillhater
100 TW
So,.. that would be Gas, or coal, then ?.......as there is nothing else that can support a significant level of demand .billvon said:It is worth quite a lot. If you want nuclear power for that, I am all for it. I am also all for the people who want it paying more for it.sendler2112 said:What is it worth to have electricity in the Winter?
TheBeastie
1 MW
Thanks for the link, yes this is quite a good example of "fossil fuel footprint/energy" vs "RE's Solar-Wind footprint/Energy" since they are building the solar panels right over the old coal-power station land.sendler2112 said:"The Lakeview Generating Station supplied power to the province of Ontario from 1962 to 2005. It generated more than 215 billion kWh of electricity in its 43 years of operation."
.
Keep in mind that they have demolished 4.000 MW of generating capacity. And in it's place now stands 44MW name plate capacity of solar. Which will actually have a capacity factor of 15% in it's snowy location. So will only average 6.6MW. 0.17% of it's former output. With many days near zero in the winter.
.
This is where we are headed. Things will be much smaller and simpler once again in the future. Simplify now and beat the rush.
.
"The Nanticoke Generating Station is a 44 MW solar power station which started operation in April 2019.[2] Previously from 1972 to 2013, it was the largest coal-fired power plant in North America. At full capacity, it could provide 3,964 MW of power into the southern Ontario power grid from its base in Nanticoke, Ontario, Canada,"
.
https://en.wikipedia.org/wiki/Nanticoke_Generating_Station
.
Quote from the Wikipedia link "Nameplate capacity 3964 MW (8 units) 1880 MW (4 units)"
You can see from this article here the picture of the completed solar farm half covered in snow matches perfectly with the cleared ground from googlemaps satellite view.
http://www.mining.com/former-coal-fired-power-plant-ontario-becomes-solar-facility/
The land-cleared area matches it in a kind of deformed irregular quadrilateral shape.
https://goo.gl/maps/eTVRFnR9eiWwW2W76
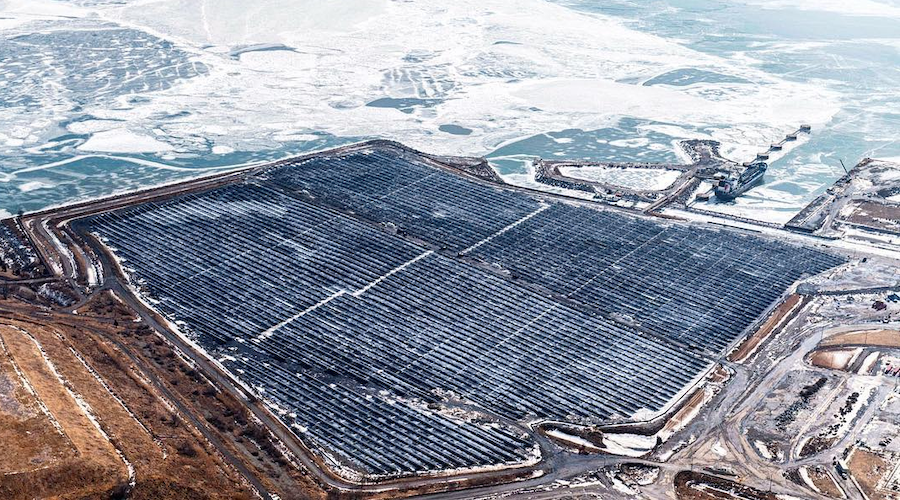
But the amazing thing is a 44MW solar farm in that location will have a similar solar capacity factor as what the UK/Northen Europe has which 10% of its claimed max power on average.
So that's really 4.4MW solar farm on average power output.
So if we take (4.4MW_average_power / 4000) = 0.0011 x 100 = 0.11% of the original plants output.
So this is a great "real-world data" example of what Solar can really do with a roughly same-sized footprint of land, that is Solar can provide 0.1% of the coals power station output on average. Nuclear is even better.
This is what's amazing about "theoretical" performance vs "real-world" performance.
While this data will not come to a surprise to any of us who have been on this thread for a long time now as we have gone over these real-world examples many times, we can do the general math in our heads without even thinking, it's still fun to do and it's a great example as its all in one spot.
Hillhater
100 TW
Key points from the interim ISO report on the Aug 9 UK grid shut down..
Power Loss
• The lightning strike and rapid frequency fall caused the loss of ~500MW of Distribution connected generation, likely to be solar and some small gas and diesel fired generation, due to the operation of the generation sources own protection systems (Loss of Mains Protectioni)
• Hornsea One offshore wind immediately lost Hornsea modules 2 and 3, totalling 737MW. Module 1 continued to operate smoothly at 50MW throughout the event.
• Little Barford Gas Power Station – near immediate loss of the Steam Turbine unit (244MW) and then, as a result of the loss of the steam unit, loss of the two Gas Turbine units (total station loss of 641MW) over the following 90 seconds.
sendler2112 said:"The Lakeview Generating Station supplied power to the province of Ontario from 1962 to 2005. It generated more than 215 billion kWh of electricity in its 43 years of operation."
3964 MW * 24 * 365 * 43 * 1000 = 1493 billion kWh
215 / 1493 = 14% "capacity factor"
WORTHLESS! GARBAGE!!! :lol:
sendler2112
100 kW
Punx0r said:WORTHLESS! GARBAGE!!! :lol:
The coal plant was relegated to dispatchable demand following after the build out of Ontario's nuclear electricity generation which provides 58%. Along with the 23% from big hydro.
.
https://www.ontario.ca/document/2017-long-term-energy-plan-discussion-guide/ontarios-energy-mix-end-2015#targetText=Electricity%20supply&targetText=Nuclear,%20natural%20gas%20and%20renewable,the%20electricity%20Ontarians%20rely%20on.&targetText=Nuclear%20generation%20provided%20the%20biggest,producing%2092.3%20TWh%20of%20electricity.
Hillhater
100 TW
Solar went off first..Punx0r said:Keep trying to somehow use this to trash RE. Let's be honest, you have a 50% chance of being "right" about which of the two generators went offline first just by guessing. You don't have a point either way...
Wind went down “immediately”
Gas (244MW) wend down. “near immediately”
.....Their words , not mine !
"Solar went off first", he cries, conveniently leaving out the "some small gas and diesel fired generation".
It's always fun to use actual facts... The interim ESO report: https://www.nationalgrideso.com/document/151081/download
A little context:
"Around 30% of the generation was from wind, 30% from gas and 20% from Nuclear and 10% from interconnectors."
" In this instance c. 5% of GB’s electricity demand was turned off (c. 1GW) to protect the other 95%. This has not happened in over a decade and is an extremely rare event."
What actually happened, from "Preliminary findings" (emphasis mine):
"Two almost simultaneous unexpected power losses at Hornsea and Little Barford occurred independently of
one another - but each associated with the lightning strike. As generation would not be expected to trip off or
de-load in response to a lightning strike, this appears to represent an extremely rare and unexpected event."
From timeline of events:
Taken at face value, Hornsea appears to have gone offline less than 0.25 seconds (11-12 AC cycles) before Little Barford. However, due to the lesser precision of the Little Barford timings it's not actually possible to tell which went offline first.
Taken any way you like, I'm curious how you will attempt to twist and contrive this as "proof" that RE "doesn't and cannot work"...
It's always fun to use actual facts... The interim ESO report: https://www.nationalgrideso.com/document/151081/download
A little context:
"Around 30% of the generation was from wind, 30% from gas and 20% from Nuclear and 10% from interconnectors."
" In this instance c. 5% of GB’s electricity demand was turned off (c. 1GW) to protect the other 95%. This has not happened in over a decade and is an extremely rare event."
What actually happened, from "Preliminary findings" (emphasis mine):
"Two almost simultaneous unexpected power losses at Hornsea and Little Barford occurred independently of
one another - but each associated with the lightning strike. As generation would not be expected to trip off or
de-load in response to a lightning strike, this appears to represent an extremely rare and unexpected event."
From timeline of events:
- 16:52:33.728 Hornsea started deloading Orsted
16:52:33.835 Hornsea stabilised at 62MW and injecting 21 MVAR [737 MW ofcumulative infeed loss]Orsted
16:52:34 Little Barford Steam Turbine trips 244MW instantaneously. Source:RWE [981MW of cumulative infeed loss]
Taken at face value, Hornsea appears to have gone offline less than 0.25 seconds (11-12 AC cycles) before Little Barford. However, due to the lesser precision of the Little Barford timings it's not actually possible to tell which went offline first.
Taken any way you like, I'm curious how you will attempt to twist and contrive this as "proof" that RE "doesn't and cannot work"...
sendler2112
100 kW
Here is some complete data from an intentional community owned solar array in Ithaca, NY 14850. This 50 kW array is privately owned and gets the best care and cleaning and shows us the actual opportunities and constraints of solar PV in snowy locations.
.
https://ecovillageithaca.org/live/living-greener/
.
The performance in Canada or Russia and Eastern European regions will be worse.
.

.
Here we see the all time electrical production of the 50kW community owned solar PV system at Ecovillage Ithaca, NY 14850. These panels are privately owned by an intentional co-op and receive the best care and cleaning. Taking the five good years value of 60,000 kWh, shows us that it is normal to expect a capacity factor of 13.7% at best for solar in upstate NY.
.

.
Electric heat and solar pv in Winter do not fit
.

.

.
There are many days near zero output in the Winter and the average for the month is only 5.5% of nameplate capacity.
.

.
15 days out of 18 with literally NO power. Again, there are many days near zero output in the Winter.
.

.

.

.

.

.
The best month ever produced 22.2% of the nameplate capacity.
.
.
https://ecovillageithaca.org/live/living-greener/
.
The performance in Canada or Russia and Eastern European regions will be worse.
.
.
Here we see the all time electrical production of the 50kW community owned solar PV system at Ecovillage Ithaca, NY 14850. These panels are privately owned by an intentional co-op and receive the best care and cleaning. Taking the five good years value of 60,000 kWh, shows us that it is normal to expect a capacity factor of 13.7% at best for solar in upstate NY.
.
.
Electric heat and solar pv in Winter do not fit
.
.
.
There are many days near zero output in the Winter and the average for the month is only 5.5% of nameplate capacity.
.
.
15 days out of 18 with literally NO power. Again, there are many days near zero output in the Winter.
.
.
.
.
.
.
The best month ever produced 22.2% of the nameplate capacity.
.
Were the panels oriented vertically and kept clean during the snow season?
What about those of us on similar lattitudes that only get a handful of snow days per year?
What about an energy mix that isn't 100% solar?
What about the projects underway to store PV generation for the winter months in thermal mass or chemical fuels?
What about those of us on similar lattitudes that only get a handful of snow days per year?
What about an energy mix that isn't 100% solar?
What about the projects underway to store PV generation for the winter months in thermal mass or chemical fuels?
Hillhater
100 TW
What about some common sense and logical reasoning ?
.. at 13, 15, even 25%, solar is still a totally unrealistic solution for utility power, and all the time remaining intermittent , and unreliable, !
.. at 13, 15, even 25%, solar is still a totally unrealistic solution for utility power, and all the time remaining intermittent , and unreliable, !
sendler2112
100 kW
Favorable regions where water, food, shelter, and energy remain abundant can expect a billion displaced migrants in the next 50 years. We will also see seasonal migration once again to follow the growing season and avoid being too hot or too cold. National borders will inevitably fall. Or there will be all out world (nuclear?) war. Easy choice.Punx0r said:What about those of us on similar lattitudes that only get a handful of snow days per year?
Yet you think a 14% capacity factor for Lakeview is totally realistic! LOL!Hillhater said:What about some common sense and logical reasoning ?
.. at 13, 15, even 25%, solar is still a totally unrealistic solution for utility power
sendler2112
100 kW
billvon said:Yet you think a 14% capacity factor for Lakeview is totally realistic! LOL!
I explained this above. The coal plant was relegated to a low on time after the build out of Ontario's nuclear plants which still supply 58%. And the 23% from big hydro. And, Where did this lifetime production number come from that we are baseng this 14 number from? Is it accurate? Wikipedia states a capacity factor of 68%.
No argument there. I was just responding to the absurd claim that a generation source with a 13-15-25% capacity factor was "a totally unrealistic solution for utility power."sendler2112 said:I explained this above. The coal plant was relegated to a low on time after the build out of Ontario's nuclear plants which still supply 58%. And the 23% from big hydro.
Similar threads
- Replies
- 0
- Views
- 323
- Replies
- 156
- Views
- 7,309

- Replies
- 4
- Views
- 723
- Replies
- 28
- Views
- 1,206