Capacity Mapping (Optimal Charge-Discharge Voltages)

.
...
DOD is major factor in cycle life!

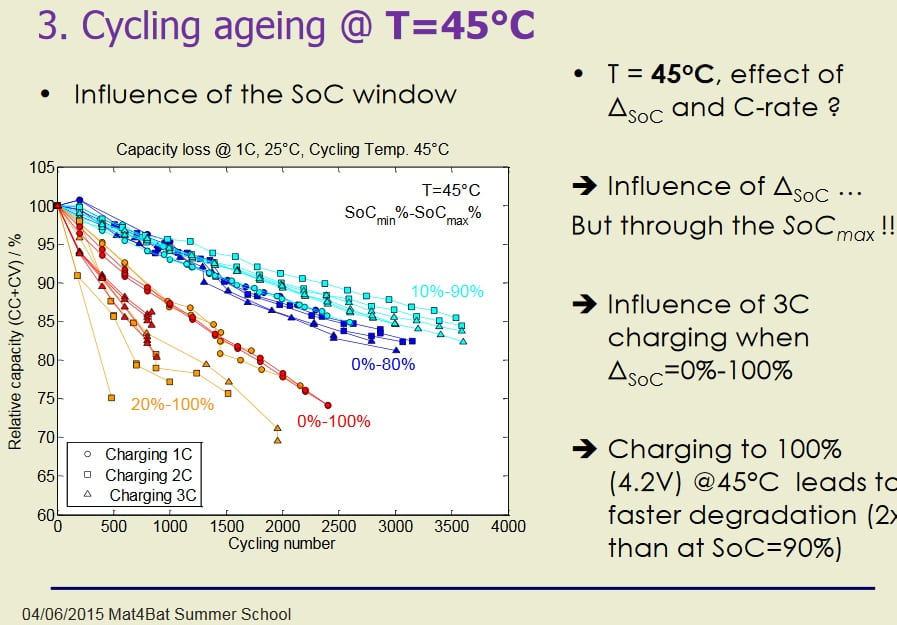
As I have long suspected, and advocated, tests and manufactures now indicate that DOD is a major factor in reducing\extending cycle life.

Manufacture clearly indicates discharging to 10%, rather than 0%, capacity doubles cycle life!
file.php


Tests clearly indicate that avoiding discharging the last 10% of rated capacity provides greatly extended cycle life!
file.php


My original reasoning was to avoid the voltage "cliff" indicated in all discharge graphs.
Going below this voltage produces the voltage sag and heat production indicating-exemplified by excessive discharge rates ... which we all know damage cells and cycle life.
There seems to be mounting evidence that DOD is nearly as critical as SOC in enhancing\degrading cycle life.
10%-90% seems to be promoted as optimal. (80% capacity with possibly 400% cycle life)
5%-95% might provide the greatest enhancement at the least capacity loss.
My testing seems to indicate that not dropping over the voltage cliff results in ≤ 5% capacity loss ... with a, now indicated, great extension in cycle life!

Please post any further proof of DOD as a major factor in cycle life ... :pancake:
 
Swing 5300

"cycle life" indicates DOD as major factor in usable life!

file.php


3.40V recommended as reasonable static DOD, but, 3.50V might double usable life! ... ?

Added scale to measure mAh incrementally.

file.php


4.2 - 4.1V 100mAh
4.1- 4.0V 450mAh
4.0 - 3.9V 450mAh
3.9 - 3.8V 500mAh
3.8 - 3.7V 525mAh
3.7 - 3.6V 700mAh
3.6 - 3.5V 1100mAh
3.5 - 3.4V 650mAh
3.4 - 3.3V 380mAh
3.3 - 3.2V 130mAh
3.2 - 3.1V 80mAh
3.1 = 3.0V 40mAh

Using Paint
Created scale from 1064mAh
Compered 10 to 4 segments
10/4 - shrunk 40%
1000/1064 - shrunk to 94% for accurate scale
copied and pasted to original picture
"copied" and dragged to measure between voltage lines to measure mAh
 
Here is another way of capacity mapping. In fact these data originate from my effort to have data displaying SOC assigned to the voltage value. It is obvious that it has to be done not only for different chemistries but individually for each cell type. I was inspired by Lygte´s work here : https://lygte-info.dk/info/BatteryChargePercent%20UK.html.
Just want to have data on actually popular cells. Without protection built in.
This graph is very first, it was just first testing of the program and parameters.
The Samsung 25R cell was hovering on the table near.


Samsung 25 R No1 capacity mapping 1A - 100 mAh.jpg

The cell was discharged by 100 mAh pulses, each step was 1 A discharge for 360 s followed by 540 s time for voltage recovering. Ambient temperature 26 ± 1°C.
Horizontal axis is in fact time line.
Voltage dropping and subsequent recovering also predicate about the energy in the area. For example it is obvious that here are two areas of concentrated energy : first 4,1 - 4 V and second 3,7 – 3,6 V.
 
Samsung INR18650-25R
Direct test comparison

Demonstrates the severe voltage sag, (with resultant heat production = cell damage), at low voltage discharge.
file.php


I did, at 1st, experiment with a similar discharge map, but decided this method to be more clear and revealing.

Demonstrates more clearly the actual energy density at various voltages. Helps determine "optimal" charge - discharge voltage ranges.
file.php


Derived from, enhanced, minimal discharge line of discharge graph. (Recovered voltage is slightly higher, but reasonably accurate.


file.php
 
I my opinion, taking minimal( 0,2 A ) discharge line doesn´t describe suitably energy distribution since in reality the current is usually higher. In fact we should make capacity maps for 1 A, 2 A, 3 A, …… or for some suitable average current.
 
Minimal discharge shows, closely, what energy is in cell at indicated voltage.
Capacity at static voltage is necessary to determine optimal charged - discharged voltages, minimal, .2A is close to static.
Release throttle to compare battery "state" during "use".

... or regulate discharge to specific amperage?
Full throttle will vary amperage from, possibly, 5C to 0.2C, dependent on attained speed, battery size, controller Amps etc. etc. etc! ... ?

Capacity maps for different Amps will merely shift capacity, different distances, towards lower voltage with a noticeable shift-stretch towards empty.
 
As part of my new SPIM08HP battery build, I decided to capacity-map one of the cells to get better range estimates.
I don't have a computerized battery analyzer or fancy charger, so I charged the battery at 8 amps in 1 AH intervals and measured the voltage with a volt meter.
Here are my raw results:

First column: Number of AH put into cell
Second column: Voltage while charging
Third column: Voltage when charging paused
Fourth column: Calculated Charging IR at ~27°c (Discharging is a bit less)

0 AH: 3.37v ------v ?mOhm
1 AH: 3.63v 3.55v 10mOhm
2 AH: 3.69v 3.63v 7mOhm
3 AH: 3.72v 3.68v 5mOhm
4 AH: 3.78v 3.74v 5mOhm
5 AH: 3.84v 3.88v 5mOhm
6 AH: 3.95v 3.99v 5mOhm
7 AH: 4.13v 4.09v 5mOhm
8 AH: --v 4.21v ?mOhm

Relative change in voltage:

0% - 12.5%: 0.25 volts
12.5% - 25%: 0.08 volts
25% - 37.5%: 0.05 volts
37.5% - 50%: 0.06 volts
50% - 62.5%: 0.14 volts
62.5% - 75%: 0.11 volts
75% - 82.5%: 0.10 volts
82.5% - 100%: 0.12 volts

As soon as I turned on the charger, the voltage shot up rapidly from 3.2 volts to around 3.4 volts. The "LiPo Cliff" on these cells seems to be right around the 3.5v/cell mark. I'm not sure if the initial high IR is due to the cells sitting in storage for years, or if it is a consequence of the "LiPo cliff". I suspect it's both.

A large portion of the capacity of these cells is stored between 3.6 and 3.8 volts. There's barely any usable energy below 3.4 or above 4.15 volts. During the last amp-hour, voltage with respect to capacity shot up rapidly after 4.15 volts; the last 300mah rapidly brought the cell up from 4.15 to 4.21 volts.

Once I build the full pack (about a month), I will be able to provide a much more accurate capacity mapping and graph, and it will be more accurate because the cells will have a few cycles on them.
 
I came across this thread by accident, neat testing.

I had no idea, the peak and valleys (capacity sections) were there in the batteries that is shown in your graphs.

I might try this on a 18650 and LiPo.
I have a couple changers i could use (306b, gt1000, isdt-Q6+ and maybe a couple others) or I might try a keithley 238 charge source supply.

So I just need to test like this?
1. discharge single cell (eliminates balance charge interfering) 18650 battery
2. charge to say 3.500V,
3. charge to 3.600v, record capacity
4. repeat every 100mV to 4.200V
5. plot data

Does this sound correct?
Then try it lower steps, like 50mV or 20mV

Have you ever tried a LiPo HV battery that charges to 4.35V? They have a lot of capacity in the 4.20v to 4.35v.
 
My first attempt at capacity mapping with a new Panasonic 18650 3400mAH cell charging at 1.0A went like this.
18650 capacity per voltage region.jpg
GT1000 capacity testing-resize.jpg
I am puzzled why your plots look completely different, this was the main reason I did my testing to see if I got the same peaks/valleys you got through the cells voltage range.

I think I will try again because letting the cell completely charge to each voltage was time consuming (35 to 48 minute per data point). I might try LogView and my iCharger 306b, this way it won't have to charge and stop at every voltage point.

Comments welcome.
 
Hillhater said:
Most of DA’s capacity mapping is done whilst DISCHARGING rather than charging.

Good to know, most discharge curves I see are relativity flat (for most of the capacity), so I am even more curious why his graphs are all bumpy. I will try and report back, thanks.
 
Update: the second graph is discharge at 1A to each datapoint on a 18650 single cell.
18650 capacity per voltage region.jpg
It does have a couple valleys, but not really like some of the graphs posted earlier in the thread.
Is it my testing method? I am using a GT1000 charger (resolution is good to 1mV, I am using 4 point kelvin connection) and 1A discharge to each voltage point.
 
You'd get a more accurate graph if you charged/discharged at a lower rate and measured more often. In your first charging graph where the voltage goes up from 3 to 3.5 in 400mah and one measurement, the "line" between those data points appears more like an exponential curve.
Your discharge graph looks pretty typical, but it'd be more accurate if you used less current. In general, when capacity mapping, you should use a low enough current that voltage drop is negligible. A current of several amps is perfectly suitable if you are using a low-IR battery like LiPo, but for lower-current 18650s I'd recommend 0.3-0.5 amps. Other than that your method for testing the cells looks just fine, but given that you have an iCharger with LogView I'd use that instead of manual testing.

Regarding my SPIM08HP pack, it is pretty much finished (with the exception of balance leads). I haven't made the capacity mapping program for my e-bike controller yet, but I should be able to bang out that program in an afternoon or two.
 
Look at the units on the Y axis, not even measuring the same thing.

But I do think your test parameters make up for lower accuracy more intuitive and straightforward
 
thorlancaster328 said:
You'd get a more accurate graph if you charged/discharged at a lower rate and measured more often. In your first charging graph where the voltage goes up from 3 to 3.5 in 400mah and one measurement, the "line" between those data points appears more like an exponential curve.
Yea, I should not of even plotted that one (3.0 start data point), in one of your lasts posts, you started at 3.5V, and thats why I have that jump. What I am seeing is very low peaks and valleys compared to most of your graphs.

I will try the iCharger with LogView (when I get it logging, last time i tried, it connects to the charger, but does not see any data, will try on a different PC).

Your discharge graph looks pretty typical, but it'd be more accurate if you used less current. In general, when capacity mapping, you should use a low enough current that voltage drop is negligible. A current of several amps is perfectly suitable if you are using a low-IR battery like LiPo, but for lower-current 18650s I'd recommend 0.3-0.5 amps. Other than that your method for testing the cells looks just fine, but given that you have an iCharger with LogView I'd use that instead of manual testing.
1A is a little bit too much, but it is only reducing total capacity about 9%.

What is the BEST storage voltage for LiPo and Li-Ion cells?

Look at the units on the Y axis, not even measuring the same thing.
I am guessing you're not talking about my plots, the Y (and X) axis is identical (0 to 500mAH).
 
--Oz-- said:
I am guessing you're not talking about my plots, the Y (and X) axis is identical (0 to 500mAH).
The original unit / scale was milliWatt hours **per** half-volt of change.

> What is the BEST storage voltage for LiPo and Li-Ion cells?

No precision required, just "lower the better" balanced against "do not allow voltage to drop anywhere near the danger point".

More critical is low temperatures, again, "lower the better" but "do not freeze" the electrolyte.
 
I've read batteries on sattelites are kept at around 3.9v.

It was said that this voltage is not too high and not too low.

Not sure to what chemistry batteries it was referred though.

More like li-ion variety for sure, not sure about its chemical structure

Sent from my ALE-L21 using Tapatalk

 
I recalled with Y axis in mWH, there is a little more peaks/valleys.
18650 capacity per voltage region -B.jpg

The reason i asked about "best" storage voltage is I tried the Hyperion G7 (6S 2800) packs, what a total disaster storing them at the industry standard 3.85V (7 different MFG chargers i have, all use 3.85V for storage), all 6 packs had one or more cells in each pack have issues (mostly high self discharge), so the voltage just drops to 0.5v to 2v on random cells. Hyperion has a note on the website to store between 3.7 to 3.8v (the precision they show is 0.1v), they never mention 50mV above 3.800v is harmful, so yes, 3.85v screws them G7 cells. they have discontinued the cells, but they still sell them to victims w/o warning.
 
Pack storage has many more factors than just voltage.
Most packs will have internal BMS or just balancing systems that can cause issues during long storage periods.
Frequent inspection and checks are your best solution to identify issues before they become unrecoverable problems.
 
"most" packs i deal with in rc have zero bms circuit, only balance leads, I can see most packs for ebikes probably do (they rarely use a good balance charger), i should of been more specific. :D
It was a painful costly experience with HvLiPo's.

For me, a 70 cent lipo alarm is all I add to any DYI packs for my bikes or kids cars/scooters, and only when i am going to use (discharge) them. If you leave these connected during storage, it drains the first two cells.
https://www.ebay.com/itm/1-8S-2-in1-RC-Li-ion-Lipo-Battery-Low-Voltage-Meter-Tester-Buzzer-Alarm-1Pcs/383136157261?hash=item5934b1ce4d:g:x2wAAOSwOiRc79Kr
 
The Hyperion batteries should be avoided, obvious lack of QA consistency, plus crazy overpriced anyway.

Many have been happy with their hobby hardware though, not too many 14S chargers made like their 1420i.
 
And yes, industry standard 3.85V is higher than what I would choose

but that is IMO not a significant cause of your problem with the cells

whatever the effect of improper care, it should be pretty uniform between cells.

Consistency in production is actually the most important QA issue in battery manufacturing
 
john61ct said:
Consistency in production is actually the most important QA issue in battery manufacturing
Yes...its called “Process Control” , and is a direct function of “Process Capability” and “Equipment Capability”,
All of which are frequently ignored in the scramble for “Cost Reduction” in industry.
 
So few sellers are more than just "assemblers", most just slap on a label.

And so few outfits that actually make the cells themselves do it well.

Altogether might be five or more companies between the ones that make the actual chemicals and the end user.

And each stage needs to be "just right" for a good final product overall.
 
Back
Top