Turnigy C80100 Performance Data

mauimart

100 W
Joined
Nov 10, 2009
Messages
216
Location
maui
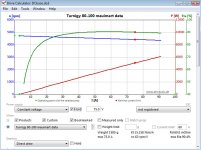
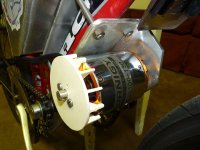
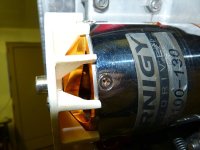
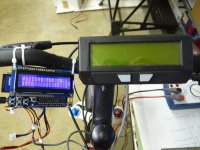
I'm currently running a rewound Turnigy 80100 and thought I would try to characterize some of its performance characteristics. This is obviously a popular motor for non-hub drive setups and as such it would be nice to know what some of its limitations are, and under what circumstances its efficiency is maximized. I recently installed a temp sensor (TMP36) between two teeth of the stator using JB-weld and today I finally finished writing the code for an arduino that will log data from the Cycle Analyst, read the temperature sensor data, append the temp data to the CA data stream, and log to an SD card. Attached is my first plot of test data for a short 2 mile hill climb (average 6% grade). As can be seen the motor heats up quite quickly with the 1860 watts average power over the 4:36 minute run. My overall goal of the project is to determine the levels of continuous power that can realistically be expected from this non-actively cooled setup. And once the limitations have been established I can start to test various cooling solutions in the hopes of getting the maximum performance out of this little power house of a motor.

I hope to add the following functionality to the data logging system:

- Ambient temperature sensor
- Motor rpm (although I can already do this using speed if I keep track of what gear I am in)
- Some sort of display (LCD or OLED) of motor temperature so I can keep an eye on things in real time
- Add GPS sensor (mostly for altitude data)
- Possibly measure and record phase amps
- Throttle position or maybe PWM duty cycle

Anyway, stay tuned for more data...
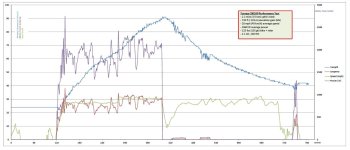
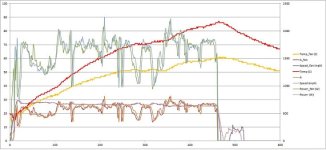
 

Attachments

  • 9_30_2012_temp_test.pdf
    166.8 KB · Views: 412
  • 9_30_2012_temp_test.jpg
    9_30_2012_temp_test.jpg
    73.2 KB · Views: 1,693
Great idea. Looking forward to your results.

Will be really good if you can get motor speed in there, as the waste heat is more to do with the torque/phase current than it is to do with the power alone.
 
I logged some more test data. It consists of a 5 mile hill climb (5.3% average grade) at WOT in 4th gear. The route is basically my commute home so it will be easy to do comparisons with varying motor and cooling solutions. The stator temperature did not exceed 100 (C) on this run of 1400W average power. I don't have a temperature probe on rotor/magnets yet my guess is that the magnets are 10 to 20 degrees cooler than the iron in the stator. Does anyone know which type of neodymium magnets are used in the Turnigy 80100? I have attached a table below with some max operating temperatures for the different types of magnets. It would be nice to know what the max operating temp is for these specific magnets.

I plan to run another test in 5th gear which will increase the loading on the motor and push the motor temp even higher. I am still waiting for my OLED display to arrive in the mail so that I can monitor the temp in real time in case a shutdown is required prior to motor melt-down.


Turnigy C80100 Motor Performance Test - 10/5/2012

Motor Configuration
- 9 turns, No. 14 AWG, Wye
- 38 mOhm phase resistance
- 63 kV (rpm/volt), 2.9A no load current @ 74.9V

Test Conditions
- 65 lbs (30kg) bike weight, 187 lbs (85 kg) rider + gear
- 5.0 mi (8.0 km), 1410 ft (430 m) elevation gain, 5.3% grade
- WOT in 4th gear
- 4.14 Ah, 290 Wh

Averages:
Voltage: 70.3V
Current: 19.3A
Power: 1354W
Speed: 23.5mph
Temperature: 78 (C)
 

Attachments

  • 10_5_2012_CA_LOG30_A.pdf
    235.8 KB · Views: 140
  • magnet thermal characteristics.jpg
    magnet thermal characteristics.jpg
    33.3 KB · Views: 4,772
This is a really good idea, specially as your testing everything with values rather then seat of your pants :) Any chance you are able to get the motor rpms up, you seem to be limited to 4900rpm atm and as far as i have read most people seem to indicate that the motor spins up to ~9000 before it starts having losses? That is alot of extra volts vrs current you could run into the motor, unless someone can extrapolate from the lower RPM to the higher one to get a complete picture :)
 
Bluefang said:
This is a really good idea, specially as your testing everything with values rather then seat of your pants :) Any chance you are able to get the motor rpms up, you seem to be limited to 4900rpm atm and as far as i have read most people seem to indicate that the motor spins up to ~9000 before it starts having losses? That is alot of extra volts vrs current you could run into the motor, unless someone can extrapolate from the lower RPM to the higher one to get a complete picture :)

The only way to increase the rpm with this motor would be to increase the voltage. This would be a significant task in re-configuring the battery setup. My controller is also nominally rated for 72V and tops out at 90V so there's not much headroom. I do have a stock wound C80100 (130kv, delta wind) that I could strap on once I have fully characterized the rewound version. It's basically twice the kV and I think I have low enough gearing where I could wind it up closer to 9000 rpm.
 
I ran a quick test today pushing just over 2kW average climbing a steep grade (15%) at WOT.
Some quick calculations comparing theoretical potential energy required to get me up the hill vs. actual energy expended:
Potential Energy = mgh = (109kg)(9.8m/s^2)(159m) = 169844 joules = 47.2 Whr
Efficiency = 47.2/67 = 70%
Not bad considering 30% losses given up for aero drag, rolling resistance, drive-train (3 chains) resistance, and motor/controller heat generation. :?

Test Conditions
- 65 lbs (30kg) bike weight, 175 lbs (79 kg) rider + gear
- 0.65 mi (1.0 km), 521 ft (159 m) elevation gain, 15% grade
- WOT in 3rd gear
- 0.95 Ah, 67 Wh, 103 Wh/mi

Averages:
Voltage: 71.6V
Current: 30.1A
Power: 2170W
Speed: 19.5mph
Temperature: 50 (C)
 

Attachments

  • 10_7_2012_CA_LOG32_A.pdf
    117.5 KB · Views: 116
  • pulehuiki elevation profile.jpg
    pulehuiki elevation profile.jpg
    88.7 KB · Views: 1,693
mauimart said:
Not bad considering 30% losses given up for aero drag, rolling resistance, drive-train (3 chains) resistance, and motor/controller heat generation. :?
Pretty good! At 19.5 mph, aero drag and rolling resistance will be around 200 Watts, that would put your average system efficiency for the test at 74%. Probably around 11% for the chain drives, the motor losses look like they're another 10% and the other 5% for the controller.
 
Interesting to see this data, thank you for showing us.

I made some rough calculations to see how much heat is generated in the motor, to compare it to the temp rise.

P_losses = P_noload_loss + P_resistive_loss

P_losses = 2.9A*75V + 2*0,038ohm*30A^2 = 286W

The run lasted about 110 seconds.

E_loss = 286W * 110s = 31.5kJ

I estimate that the stator is made of 1,5kg copper and iron. The heat capacity should be around 0.42 kJ / (kg * K) (copper is 0.39, iron is 0.45).

deltaT = E_loss / (m_stator * c_stator) = 31.5kJ / (1,5kg * 0.42 kJ / (kg * K)) = 50K

This calculation was very rough, but it proved to be spot on(!?), since in your graph, the temp rose from about 25°C to 75°.

The shape of your graph tells me that the natural cooling of the motor isn't very good. I don't think the motor can reach the nominal current from Drive calc. With a radial fan on the rotor, I think it may though.

Miles, why did you use 60mOhm in drivecalc?
 
bearing said:
I don't think the motor can reach the nominal current from Drive calc. With a radial fan on the rotor, I think it may though.

Miles, why did you use 60mOhm in drivecalc?
The nominal current was just a value I stuck in to give the correct graph scaling... :)

60mOhms is the figure for dynamic resistance (Rd) derived by the program, I entered mauimart's 38 mOhm figure.
 
Hm, I wonder how that is derived...

By the way, is the resistance 38mOhms phase to phase, or phase to center?
 
Miles said:
bearing said:
By the way, is the resistance 38mOhms phase to phase, or phase to center?
I assumed it was phase to phase. Please let us know if it isn't mauimart.

The phase resistance for this rewound motor is 38mOhms, that is the resistance between any one of the phase leads and the center tap of the wye. The phase-phase resistance (e.g. A to B) is twice that or 76mOhms.
 
mauimart said:
The phase resistance for this rewound motor is 38mOhms, that is the resistance between any one of the phase leads and the center tap of the wye. The phase-phase resistance (e.g. A to B) is twice that or 76mOhms.
Thanks. My bad. You did write phase resistance and, comparing with the original, your rewinding did look a bit too impressive :)

I'll redo the DriveCalc plot.
 
Awesome!

Subscribed!
 
mauimart said:
I ran a quick test today pushing just over 2kW average climbing a steep grade (15%) at WOT.
Some quick calculations comparing theoretical potential energy required to get me up the hill vs. actual energy expended:
Potential Energy = mgh = (109kg)(9.8m/s^2)(159m) = 169844 joules = 47.2 Whr
Efficiency = 47.2/67 = 70%
Not bad considering 30% losses given up for aero drag, rolling resistance, drive-train (3 chains) resistance, and motor/controller heat generation. :?

Test Conditions
- 65 lbs (30kg) bike weight, 175 lbs (79 kg) rider + gear
- 0.65 mi (1.0 km), 521 ft (159 m) elevation gain, 15% grade
- WOT in 3rd gear
- 0.95 Ah, 67 Wh, 103 Wh/mi

Averages:
Voltage: 71.6V
Current: 30.1A
Power: 2170W
Speed: 19.5mph
Temperature: 50 (C)
Wow thats more efficient for a small motor then I'd expect.
 
According to this calcs and graphs, the motor is putting out zero watts in heat...
In desperate need of cooling for longevity, reliability and efficiency.

Fan cooling, water spray... 8)

bearing said:
Interesting to see this data, thank you for showing us.

I made some rough calculations to see how much heat is generated in the motor, to compare it to the temp rise.

P_losses = P_noload_loss + P_resistive_loss

P_losses = 2.9A*75V + 2*0,038ohm*30A^2 = 286W

The run lasted about 110 seconds.

E_loss = 286W * 110s = 31.5kJ

I estimate that the stator is made of 1,5kg copper and iron. The heat capacity should be around 0.42 kJ / (kg * K) (copper is 0.39, iron is 0.45).

deltaT = E_loss / (m_stator * c_stator) = 31.5kJ / (1,5kg * 0.42 kJ / (kg * K)) = 50K

This calculation was very rough, but it proved to be spot on(!?), since in your graph, the temp rose from about 25°C to 75°.

The shape of your graph tells me that the natural cooling of the motor isn't very good. I don't think the motor can reach the nominal current from Drive calc. With a radial fan on the rotor, I think it may though.

Miles, why did you use 60mOhm in drivecalc?
 
h0tr0d said:
According to this calcs and graphs, the motor is putting out zero watts in heat...

I think you misunderstood something, or isn't making yourself clear. I don't see anything in this thread saying that the motor is not making any heat.
 
made a mistake in expressing myself.

Motor is not putting out heat to the atmosphere, keeping all the heat inside... Right?

Nice calcs by the way. Are you an engineer Bearing?

bearing said:
h0tr0d said:
According to this calcs and graphs, the motor is putting out zero watts in heat...

I think you misunderstood something, or isn't making yourself clear. I don't see anything in this thread saying that the motor is not making any heat.
 
h0tr0d said:
Motor is not putting out heat to the atmosphere, keeping all the heat inside... Right?

Nice calcs by the way. Are you an engineer Bearing?

Ah, I see, yes I neglected heat dissipation from the motor, since the calculations were very rough to start with. Also, it looks like cooling isn't very effective, since the temperature is falling slowly after the power is shut off, in 10_7_2012_CA_LOG32_A.pdf. Oh yah, me is engineer.

Fan cooling, water spray...
The would be nice. One, or a few, dl of water is probably enough to keep any ebike-motor below 100°C for the range of the battery.
 
I just received a couple of Thud's C80100 cooling fans and have some preliminary results to share.
Two near identical test runs were completed, one without the cooling fan and one with.
The bottom line is a greater than 20C improvement with the fan. See chart and graph below. +1 for Thud!
Important to note that the entire test was run at WOT which translates to approximately 4000-4500 rpm range which maximizes fan effectiveness.
The results are very encouraging. The cooling gains would be even better if the end cap of the motor were more open. More testing to follow...
 

Attachments

  • fan_chart.jpg
    fan_chart.jpg
    15.9 KB · Views: 4,835
  • fan_graph_small.jpg
    fan_graph_small.jpg
    39.2 KB · Views: 4,835
  • P1080449.JPG
    P1080449.JPG
    71.9 KB · Views: 4,835
  • P1080455.JPG
    P1080455.JPG
    64.6 KB · Views: 4,835
  • P1080437.JPG
    P1080437.JPG
    75.3 KB · Views: 4,835
Back
Top