Homemade Battery Packs

John in CR said:
DrkAngel,

When I was building packs using recycled cells, for matching them I tested large numbers of them at once to determine relative capacity. They were blocks of 2p cells with each 2p nominally 3ah. I paralleled all of the same size blocks to charge all cells to an identical voltage. Then I connected them all in series and using a series string of incandescent light bulbs I discharged 2ah. Then I separated them and measured their ending voltage and assigned a grade to each block of cells. Those with the highest voltage had the highest capacity and got an A grade for example.
I modded a 5V 30A Meanwell for 4.2V charging. Ganged together batches of 40p and charged-equalized. Making sure to monitor for any cells heating up and removed them as defective.

Separated and let set for several days, removed any with significant self-discharge.

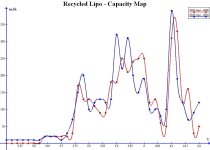
Then capacity tested.
Latest methods:
See - Bulk Capacity Testing

"Method One"
I ran 30s ~120V through 2p - 60w light bulbs which drains 1 amp.
Each hour of discharge = 1000mAh of capacity. Similarly, I monitored cells, removed a few after 2 1/2 hours 2500mAh, stopped discharge on the rest at 3 hours (3000mAh), then graded the cells by remaining voltage as fair, good, very good and excellent.

"Method Two"
Is similar except I added a Ah meter and withdrew cells when they reached "optimal DOD" 3.7V (3.3V under 1A drain). This allowed precise mAh rating for each pair. Of course this required continuous monitoring during the last 2 hours. I did use a 3 wire type meter (separate battery for meter) so that meter retained readings when disconnected.
(18s on 1st test, but designed for 30s 30 pairs = 60 cells.)
2 100w light bulbs (2A) for faster process ... better to drop back to one bulb (1A) when cells start nearing empty, cells drop voltage quickly when near "empty" (3.5V?) and can heat up dangerously!

IR (Internal Resistance)
I began running a comparative IR test on all cells.
Easiest was with the Lipo 6packs 3s2p, I merely applied a 2.5A 12V fan to 12.3V 4.32Ah pack and subtracted voltage of pack after fan attained full speed, from original voltage. Comparative IR varied from .5V to 1V. Cells were discharge tested in batches of similar IR.
Any identically applied discharge of ~.5C should give a good "comparative IR".
Note: While a valuable consideration, IR proved to be a very poor indicator of cell capacity!

Improvements?
2 100w ligt bulbs (~2 Amp discharge)
2 sets of 30s discharging at a staggered time, necessitating minimal attention to one string when other requires constant. Can be overlapped and process several strings of 30s in one prolonged session. Test can be delayed-stopped at any time then resumed later, independent battery for meter retains mAh discharged.
 
Hi, thank you for an inspiring forum thread! :)

I`m thinking of making a battery pack for my 12v 55 lb el-motor on my boat. The boat motor is recommended with a 100ah deep cycle battery and have a max draw at 55 amps...

What about making a 3s40p battery pack. That would be 120 18650 batteries making 80 ah, right? Do you think it will work?

(I`ve made some smaller battery packs (3s4p) earlier this year for my depth finder, so I have some experience)

:)
 
kje said:
Hi, thank you for an inspiring forum thread! :)

I`m thinking of making a battery pack for my 12v 55 lb el-motor on my boat. The boat motor is recommended with a 100ah deep cycle battery. I`m not shure about this but I`ve read that an efficient trolling motor produces 1 lb of trust per amp. If my electric motor is putting out 55 lbs of thrust it should draw 55 amps?

What about making a 3s40p battery pack. That would be 120 18650 batteries making 80 ah, right? Do you think it will work?

(I`ve made some smaller battery packs (3s4p) earlier this year for my depth finder, so I have some experience)

The numbers work out, but it all depends on that amp draw. You could test the motor & measure those amps using another battery to get some idea of performance and amps needed. Depends on how far/fast you want to go too.

Check Out This Area of the Forum:

Electric Watercraft
 
deVries said:
The numbers work out, but it all depends on that amp draw. You could test the motor & measure those amps using another battery to get some idea of performance and amps needed. Depends on how far/fast you want to go too.

Check Out This Area of the Forum:

Electric Watercraft

Thank you, I found out that the max draw on the el-motor is at 55 amps...
 
kje said:
Thank you, I found out that the max draw on the el-motor is at 55 amps...
Much better to keep continuous usage below .5C, so 110Ah battery capacity recommended ... if continuous demand is 55A. 150 cells is still less than 20lb!
So 3s50p of good condition used cells.
Also, that would give you a 2 hour run time. New 100Ah SLA (100lb+) would barely give you 1 hour.

More is definitely better!
Even "fair" condition cells have a better energy density than SLA, adding them to a pack of good cells will help.
Axillary "add-on module"?
Emergency "limp home" pack?

CAUTION! Add fuse to pack (60A?)
Pack has discharge capability similar to an arc welder.
Store in waterproof box.

Large 12V pack is also handy emergency power ... keep:
12V florescent camp lantern
12V DC to 120V AC inverter
etc
handy.

Bonus! Capacity testing, for large packs is not "necessary".
Bleed down test recommended, this eliminates almost all bad-poor cells!
Build pack in 3 equal banks.
Discharge ... till one bank dips below ~3.7V.
All 3 banks should be of various voltages, mark as H M L (High Medium Low).
Recharge to equal voltages.
Remove cell (cells) from H bank and add to L bank, or add cell to M and more cells to L bank.
Repeated monitored cycles will allow you to create nicely balanced capacity pack.
 
DrkAngel said:
kje said:
Thank you, I found out that the max draw on the el-motor is at 55 amps...
Much better to keep continuous usage below .5C, so 110Ah battery capacity recommended ... if continuous demand is 55A. 150 cells is still less than 20lb!
So 3s50p of good condition used cells.
Also, that would give you a 2 hour run time. New 100Ah SLA (100lb+) would barely give you 1 hour.

More is definitely better!
Even "fair" condition cells have a better energy density than SLA, adding them to a pack of good cells will help.
Axillary "add-on module"?
Emergency "limp home" pack?

CAUTION! Add fuse to pack (60A?)
Pack has discharge capability similar to an arc welder.
Store in waterproof box.

Large 12V pack is also handy emergency power ... keep:
12V florescent camp lantern
12V DC to 120V AC inverter
etc
handy.

Bonus! Capacity testing, for large packs is not "necessary".
Bleed down test recommended, this eliminates almost all bad-poor cells!
Build pack in 3 equal banks.
Discharge ... till one bank dips below ~3.7V.
All 3 banks should be of various voltages, mark as H M L (High Medium Low).
Recharge to equal voltages.
Remove cell (cells) from H bank and add to L bank, or add cell to M and more cells to L bank.
Repeated monitored cycles will allow you to create nicely balanced capacity pack.

Thank you. Many good answers here.

Does it work to combine some flat Li-ion cells (from iTablets) that is 1800mah together with 18650 cells (from laptops) that is between 2200mah and 2400mah? Will the capacity always be the same as the weakest cells?

What do you decide as good condition used cells? What do you determine as a limit of usable cells?
 
kje said:
Thank you. Many good answers here.

Does it work to combine some flat Li-ion cells (from iTablets) that is 1800mah together with 18650 cells (from laptops) that is between 2200mah and 2400mah? Will the capacity always be the same as the weakest cells?

What do you decide as good condition used cells? What do you determine as a limit of usable cells?
Don't mix flat cells (Lipo) and 18650 cells.
Capacity is the total of cells added together, 2200mAh & 2400mAh = 4600mAh = 4.6Ah.
See - Cell Testing
And - Bulk Capacity Testing
Or - Homemade Battery Packs - Index (Updated)
 
Some swear by the "almighty" Internal Resistance of their cells.

Comparative IR Test
Partly to see for myself, I began testing my recycled laptop cells using a comparative IR.
Technically, IR is to be determined at a 1C discharge.
Due to the high IR of laptop cells and considering that I only wanted to compare against "like" laptop cells, I decided to determine a comparative IR at a .5C (C/2) discharge rate.
Most of my packs recycled cells are prepackaged in a 3s2p configuration, 12.3 - 12.6V and 4400 - 5200mAh at optimal full charge.
This made it easy, I began testing with a 2.5A 12V fan.
With cells at optimal full charge I attached fan, waited for cell sag to stabilize, then subtracted sag voltage from original voltage.
Comparative IR varied from .5V to 1.0V (4 - 8% sag).

IR as a measure of capacity
I recently tested the Comparative IR of 50 x 6packs = 300cells before doing a capacity test.
Comparative IR demonstrated no relation to actual capacity of cells!

IR Variance!?
I mentioned that I took the comparative IR at the optimal full voltage.
My recycled lipo cells are "optimal full charged" at ~4.10V per cell.
At 4.2V these cells demonstrated a much higher IR.
In fact IR varied drastically throughout the discharge cycle!
Best was near 3.9V and at below 3.6V was horrifically bad.

Conclusions?
I see the advantage to building packs using all cells of similar IR, this will help equalize all banks for like discharge and performance.
A lower-matched IR is ideal, especially for high drain applications. I used in determining and matching cells for power tool power pack rebuilds, (14.8V and 18.5V Black & Decker power 1.2 - 1.4Ah NiCd < 4.32 - 5.2Ah Lithium Cobalt)
Accurate comparative IR must be determined at an optimal full voltage or at a specific voltage deep in the best capacity region of the cells.
IR seems to have absolutely no relation to cell capacity.
 
Index updated!

There are multiple purposes to building a capacity profile for your battery pack.

It is a commonly known fact that higher charge voltages and lower Depths of Discharge both destroy capacity and quantity of usable cycles!
Knowing the capacity advantage gained by every fraction of a volt should help you determine your batteries optimal voltage range.
Commonly, there is a central region of plush capacity. Higher and lower voltages are by comparison bleak deserts, sparsely populated with minimal mAhs of capacity.
Keeping your battery within this central, energy rich, region preserves capacity and longevity of your battery.
Many manufacturers and most "experts" insist that usable lifespan of a battery can be doubled, or better, by trimming voltages at these energy poor higher and lower voltages.

DrkAngel said:
I thought it might be illuminating to gauge the capacity of my lithium-ion (Cobalt) Lipo pack.
Method -
Begin with cells at 3.5V (my recommended minimum voltage)
Precisely charge to 3.6V - measure Ah needed
Repeat at .1V intervals until 4.2V (my recommended maximum voltage)

Tools -
MeanWell 24V bulk charger (19.8 - 29.8V adjustable)
30V 4 digit volt meter, 100ths capable
Ah meter

I discharged my 25.9V recycled Lipo pack to 24.5V.
Then precisely equalized the cells at 3.50V.
I applied charge with MW (MeanWell) set to:
25.20V (3.60V) - full charge required .27Ah
25.90V (3.70V) - full charge required .53Ah
26.60V (3.80V) - full charge required 3.87Ah
27.30V (3.90V) - full charge required 3.15Ah
28.00V (4.00V) - full charge required 4.60Ah
28.70V (4.10V) - full charge required 4.10Ah
29.40V (4.20V) - full charge required 1.85Ah
(Ah is capacity between each .10V)
----------------------------------------
Total. .................... 18.37Ah
Ah capacity previously confirmed with -
iMax B8 full charge ..... 18.4Ah

I was both disturbed and inspired at the lack of capacity below 3.7V

With these cells ... discharging below 3.7V is needlessly damaging.
Almost 90% of the usable Ahs is between 3.7V and 4.1V.

The above test is very demonstrative of the energy rich and poor voltage regions of my most common recycled cells.
Initially I charged to 4.2V and sometimes discharged below 3.7V.
After running the test I began charging to 4.1V and limiting discharges to above 3.7V.
Doing so I extended pack life to 100s and 100's of cycles and more than 6,000 miles.

Since I am presently building several packs using these cells, I feel it advisable to re-test the cell type.
The above test, at 1/10th V increments, is too coarse for an accurate evaluation.
So I intend on the more precise measure of 1/50th V increments.
Test will be from a starting voltage of 3.5V per cell to 4.2V per cell, this will be total of 35 readings, every .02V.
Hopes are for a precise map of the "Optimal Capacity Region".
Stringently remaining in this region should greatly enhance battery durability and capacity.
I anticipate years of productive daily use.
Initial usable capacity might be less, for many dozen cycles ...
But should, after that, stabilize-maintain greater useable capacity ... for years!

Many have trouble grasping the concept so ...

Worker - Battery Analogy
4.20V - 3.5V (full test voltage as measured - above)
Wake up your worker before day break and drag him into the field.
Bring him in at morning to feed him breakfast and let him wake up fully..
Put him back in the field and let him work the field till becoming tired.
Then push and drive him till totally exhausted.

4.1V - 3.7V (Optimal test voltage as measured - above)
Wake up your worker in the morning and feed him breakfast.
Let him work the field till before becoming tired.

I think that the low productivity and physically damaging higher and lower voltages are accurately represented.
Initially there will be a greater output!
But weak, early and late productivity, combine with an erosion of daytime health-capacity to quickly decrease overall production, as well as greatly decreasing the lifespan of usability.
Damage is progressive and accelerates.

Concurrently, I believe that I will chart an IR map.
As a 2nd, parallel, test I will use my 2.5A 12V fan, on a 3s 4.32Ah pack at each voltage to map the IR (Internal resistance) for a direct comparison to the capacity map.
Will use the same MeanWell power supply but have Ah meter only on the capacity test pack.
Testing with 3s2p 4320mAh packs allows 100th V with basic multimeter (<20V range).
 
Hey DA, i like your thinking ..a different way of testing and understanding these little mystery packs !
I was struggling to understand your capacity charting, but that last post and the "worker analogy" clarified it precisely ..thanks
Looking forward to the results !
 
My earlier capacity profiles-maps were drawn from discharge data. This resulted in a bit of profile "distortion" due to voltage sag.
Present method, charting the mAh required to raise pack voltage should provide precise and clear evidence as to the capacity increase provided by increasing charge voltage, readings will be charted using pack voltages after charging voltages removed, using meter on pack so as increase accuracy.
Likely I will chart mAh per 100ths V at the critical, high and low, optimal capacity transitions.

Tests scheduled for rainy day ... tomorrow.
 
My first favorite cell was the Samsung pink 2600mah laptop cell.

After much testing and getting to know that cell I could spot a good or bad one in a short time charging or discharging because I knew how a good pink Samsung cell charged and discharged.

Other brands had their own charge and discharge ways

I am thinking an Arduino could be programmed to look at a good cell discharging, log the good cell discharge and compare that to other same brand and type cells and spot the good or bad cells in a few seconds.
 
Recycled Lipo "Capacity mapping", preliminary test completed.
I say preliminary ... while 1st run confirmed ~3.7V - ~4.1V as "optimal capacity range ... there was some unexpected data and I wish to repeat the test with alternate cells of identical type.

Cells
Recycled laptop CD bay "secondary battery" 2160mAh Lithium Ion (cobalt) cells.
Arraigned as 3s2p 11.1V 4.32Ah "6 packs".

The Test
Begin with cells at a deeply discharge 3.5V per cell.
Attach a digital Ah meter and volt meter.
With a precisely adjustable, 20 turn pot added, MeanWell power supply (or compatible) charge battery pack in incremental steps and record the mAh between each step.
This should precisely "map" how much capacity is contained at each region of cell voltage.
Previous test demonstrated that the majority of capacity was nicely concentrated between 3.7V and 4.1V, but was only measured in .1V increments.
See - Capacity Test
Alternate method produced this map -
file.php

This present test measures in 2/100th V per cell increments, (6/100ths for 3s2p 11.1V 6 pack), with the purpose of more precisely mapping for optimal charge and discharge voltages.

This is based on the reasonable premise that charging to voltages where minimal energy capacity is stored and discharging to voltages where minimal capacity is stored is needlessly damaging.

Also see - Lithiums - mAh per 100th Volt - Capacity Test
 
DrkAngel said:
My earlier capacity profiles-maps were drawn from discharge data. This resulted in a bit of profile "distortion" due to voltage sag.
Present method, charting the mAh required to raise pack voltage should provide precise and clear evidence as to the capacity increase provided by increasing charge voltage, readings will be charted using pack voltages after charging voltages removed, using meter on pack so as increase accuracy.
Likely I will chart mAh per 100ths V at the critical, high and low, optimal capacity transitions.

Tests scheduled for rainy day ... tomorrow.
Capacity mapping by charge mAh ... completed.
I repeated the test, results seemed unreasonable-unbelievable, so I had to repeat using alternate cells and a more precise-reliable adjustment of power supply. I added a 20 turn 5k pot to a 24V MeanWell, this allowed precise and stable 100th V adjustment between 10.5V and 12.5V.
But results were remarkably similar! ???
So ... the results!

1st test was performed on a 3s2p 11.1V 4320mAh 6 pack of Lipo cells, with a 2006 date of manufacture - Red line (3760mAh metered)
2nd test was performed on a 3s2p 11.1V 4320mAh 6 pack of Lipo cells, with a 2004 date of manufacture - Blue line (3930mAh metered)
Accurate capacity measure was a nice bonus, but the purpose of the test was to determine optimal charge and discharge voltages

Recycled Lipo - Capacity Maps.JPG

Conclusions:
As expected, discharging below a 3.75V resting voltage is worthless!!!
Under load this might be 3.5V, or lower, but ... with throttle released and voltage recovered, battery should not be discharged below 3.75V. With cell voltage at ~3.8V, apply typical throttle, note the resultant voltage and set this as your "under throttle" maximum DOD.

My previous recommendation that maximum pack voltage should be limited to 4.10V, or even 4.05V, neglects a massive "muscle" of capacity! Charging to 4.15V, possibly a bit higher, now seems optimal!

Tenergy Intelligent 2A Charger for 25.9V 7S Li-ion / Li-Polymer Battery Pack - $23.99 Now looks to be an even better match for my 7s builds with these cells. Pack seems to charge to 4.18V per cell-bank. Charger is small and light enough to carry around, less than 1lb.
New! Better price on 7s 25.9V 2A charger - $14.95!

Important! This "Capacity Map" is valid only for this specific model of Lipo cell. Various models, manufacturers vary greatly!!!
 

Attachments

  • Recycled Lipo - Capacity Map.jpg
    Recycled Lipo - Capacity Map.jpg
    54.3 KB · Views: 3,769
DrkAngel said:
1st test was performed on a 3s2p 11.1V 4320mAh 6 pack of Lipo cells, with a 2006 date of manufacture - Red line (3760mAh metered)
2nd test was performed on a 3s2p 11.1V 4320mAh 6 pack of Lipo cells, with a 2004 date of manufacture - Blue line (3930mAh metered)
Accurate capacity measure was a nice bonus, but the purpose of the test was to determine optimal charge and discharge voltages

file.php


Conclusions:
As expected, discharging below a 3.75V resting voltage is worthless!!!
Under load this might be 3.5V, or lower, but ... with throttle released and voltage recovered, battery should not be discharged below 3.75V. With cell voltage at ~3.8V, apply typical throttle, note the resultant voltage and set this as your "under throttle" maximum DOD.

My previous recommendation that maximum pack voltage should be limited to 4.10V, or even 4.05V, neglects a massive "muscle" of capacity! Charging to 4.15V, possibly a bit higher, now seems optimal!

New! Better price on 7s 25.9V 2A charger - $14.95!
Now looks to be an even better match for my 7s builds with these cells. Pack seems to charge to 4.18V per cell-bank. Charger is small and light enough to carry around, less than 1lb.


Important! This "Capacity Map" is valid only for this specific model of Lipo cell. Various models, manufacturers vary greatly!!!
Test Notes:

Using the 1st test as a template, I accelerated chargeing to <.3C during previously indicated regions of large capacity. Charge was removed and let set for a full minute before measuring, so as to get accurate measure.

Near 4.20V, the upturn in capacity is of suspect accuracy. While all other voltage measurement were constantly attended, ending voltages were set to final voltages and left unattended for a prolonged period of time. This would allow a saturation charge with an exaggerated capacity, compared to previous measurements which were charged at a higher voltage then allowed to settle back to a lower retained voltage, for 1 minute. So, I believe that any substantial capacity ends just before 4.20V. Very likely, both of the last 2 graph points, and almost certainly the 3rd to last red point, are erroneous.

Most unexpected was the drastic dip in capacity at 4.07V, I could not believe it, so I decided to repeat the test using an alternate power supply and cells. Getting an identical dip for 2 tests using similar cells, differing by 2 years date of manufacture (2004 & 2006), validate this "desert region" of capacity as valid. I will perform 1 additional test using the "new" 2009 cells I have reserved for eZip packs, discharge will be limited to 3.65V, as both previous tests indicated no usable capacity below ~3.75V.

Encouraging was the 80-90% of oem rated capacity from used 7 and 9 year old battery packs!

Most encouraging was that the the great majority of the Lipo 3s2p 6packs retained voltage very equally and demonstrated excellent equalization of cells even when drastically discharged to a 3.5V resting voltage. This indicates an extreme degree of precision-quality control during manufacture. Any RC type Lipo packs I've worked with perform horrendously by comparison. Even recycled laptop 18650 cells, that I have ever worked with, maintain "equalization" pitifully in comparison.
 
file.php

IR test.jpg

Ran an IR (Internal resistance) test as a companion test to the capacity map "charge" test.
"IR" test was a comparison IR test performed at a ~.60C discharge rate, 2500mA from ~4000mA capacity cells.
Cells in 3s2p pack were discharged then allowed to stabilized voltage, then applied a 12V 2500mA fan, fan was allowed to reach full speed then run 10 seconds before IR test voltage was recorded.

"IR" was reasonably consistent at a .1V "sag" ... until static voltage dipped below 3.75V, where IR began to plummet.
This concurs nicely with the capacity map results.
I stopped at just below 3.75V per cell as previous test demonstrated negligible capacity below this point.
If run again I would have ran one or two more steps to illustrate the presumed severe IR results below 3.75V.

Equivalent "sag" from a continuous ~16A discharge would be 28.37V from a 29.05V 25.92Ah (7s12p - 4.15V per cell) Lipo Pack.

Note:
These results are for one type-formulation of Lithium Cobalt - Lipo battery.
Most every other type will have differing optimal voltages!
Exampled test procedures should work nicely in determining your own battery optimal voltages.
 
Fibreglass is nice, especially with homemade packs.
 
cwah said:
What's the cheapest (hard) battery enclosure material? I'm currently using wood but it's too thick
Check out the toolboxes at your local hardware store.
Look at the lunch boxes and coolers at department stores.
Metal builds and fabric lunch bags work, but require an inner barrier ... plastic, Masonite, Formica, high-density closed cell foam or similar.
If you want super durable ... look for old jewelry cases at used shops, flea markets etc.

Masonite, (dense, strong, durable, fire resistant), might make a good custom shaped battery box, but requires corner-seam connection.
PL200 construction adhesive?
Gorilla tape all seams?
Leftover scraps from bathroom wall paneling works best, incorporates a strong, water resistant, additional layer.

See - "Forming" Custom Size Battery Cases
 
DrkAngel said:
"IR" was reasonably consistent at a .1V "sag" ... until static voltage dipped below 3.75V, where IR began to plummet.
This concurs nicely with the capacity map results.
I stopped at just below 3.75V per cell as previous test demonstrated negligible capacity below this point.
If run again I would have ran one or two more steps to illustrate the presumed severe IR results below 3.75V.

Equivalent "sag" from a continuous ~16A discharge would be 28.37V from a 29.05V 25.92Ah (7s12p - 4.15V per cell) Lipo Pack.

Note:
These results are for one type-formulation of Lithium Cobalt - Lipo battery.
Most every other type will have differing optimal voltages!
Exampled test procedures should work nicely in determining your own battery optimal voltages.
I regretted ending the IR test at too high a voltage, so I continued with a "6 pack" of near voltage.

IR Test 2.0s.JPG
IR increased from a best of <.1V to >.25V, before I terminated test below 3.7V.
 
DrkAngel said:
DrkAngel said:
"IR" was reasonably consistent at a .1V "sag" ... until static voltage dipped below 3.75V, where IR began to plummet.
This concurs nicely with the capacity map results.
I stopped at just below 3.75V per cell as previous test demonstrated negligible capacity below this point.
If run again I would have ran one or two more steps to illustrate the presumed severe IR results below 3.75V.

Equivalent "sag" from a continuous ~16A discharge would be 28.37V from a 29.05V 25.92Ah (7s12p - 4.15V per cell) Lipo Pack.

Note:
These results are for one type-formulation of Lithium Cobalt - Lipo battery.
Most every other type will have differing optimal voltages!
Exampled test procedures should work nicely in determining your own battery optimal voltages.
I regretted ending the IR test at too high a voltage, so I continued with a "6 pack" of near voltage.

IR increased from a best of <.1V to >.25V, before I terminated test below 3.7V.

file.php

IR Test 3.0s.JPG
This graph version, which measures only IR, demonstrates IR increase at "empty" much better.
 
DrkAngel said:
cwah said:
What's the cheapest (hard) battery enclosure material? I'm currently using wood but it's too thick
Check out the toolboxes at your local hardware store.
Look at the lunch boxes and coolers at department stores.
Metal builds and fabric lunch bags work, but require an inner barrier ... plastic, Masonite, Formica, high-density closed cell foam or similar.
If you want super durable ... look for old jewelry cases at used shops, flea markets etc.

Masonite, (dense, strong, durable, fire resistant), might make a good custom shaped battery box, but requires corner-seam connection.
PL200 construction adhesive?
Gorilla tape all seams?
Leftover scraps from bathroom wall paneling works best, incorporates a strong, water resistant, additional layer.

Thanks Darkangel, I can't use pre-made box as I have specific space for the battery compatiment:
20130920_173411.jpg


I purchased it second hand and battery has been lost. Not sure how to replace the missing battery yet
 
My most commonly used cells.
These red cells (2600mAh) are commonly considered to be of Sanyo origin.
I finally got around to trying my capacity mapping using charge mAh per 2/100th V method.
These cells were part of a recent batch from Lenovo battery packs.
This 3s3p pack was chosen due to high capacity (7500mAh+) and equal voltage between cells in series.
I only discharged to 3.60V.

Li-ion Sanyo s.JPG
While peak optimal charge is inconclusive, maximum DOD is clearly near 3.7V.
If you wish to reduce wear and tear ... 3.75V - 4.10V looks to be great discharge - charge voltages (or 3.8V to 4.05V).
Compare this to the capacity map I created using discharge mAh per 100thV.
file.php

There is a noticeable "sag"-shift towards lower voltage, 1/10V shift towards lower voltage matches charge graph reasonably well.
Capacity mapping during charge seems much more accurate for determining resting voltage-capacity.

Alternate, and "actual use" mapping test would be discharging at typical usage rate and measuring mAh used for every 100th V of voltage drop.
End test when mAh between each 100th V diminishes sharply, and designate that as maximum DOD.
 
Of course I compare my capacity maps.
(18650 Li-ion factors reduced to 60% for direct comparison.)
Well I noticed what seemed to be a shift in the peaks of capacity.
Both cells are Lithium Cobalt but it seems that the Lipo uses some modified formulation that shifts the capacity regions toward higher voltages?

Li-ion vs Lipo shift s.JPG
Actually, the Sanyo cells are newer, they are probably the cells of modified (improved?) formulation.
Another clue in understanding Lithium batteries?
Just another data tidbit added to my vast storehouse of worthless(?) knowledge.
 
Back
Top