Capacity Mapping (Optimal Charge-Discharge Voltages)

The shape of those graphs is really unexpected but interesting.

Most manufacturers make a graph of voltage vs. mAhr during a constant current discharge, which should provide the same kind of information if you process the data differently.
 
Mapped Cells ... Round-up

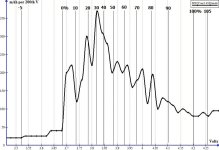
2004 & 2006 Dell laptop recycled LiPo - 3.7V 4320mAh (2p) cells
These cells have remarkable durability and resistance to "age deterioration"
Unique, so far, is the severe dip in capacity near 4.05V followed by the impressive capacity bulge between 4.10-4.15V!
Excellent QC, cells in pack retaining equal capacity and "bleed down".
8-10 years old ... 500++ cycles 7000+ miles ... with still ~50% original capacity
(Note: C rate seems to diminish equally with capacity! - C Rate seems tied to actual, rather than original, capacity.)
"Optimal" voltages rated at:
>3.75-4.15V best usable capacity ~150% usable cycles
>3.75- 4.02 = maximum life ~400% usable cycles

file.php


Sanyo 2600mAh (3.6V 5200mAh -2p)
Very common
Quality varies, Some batches display good pack equalization, other batches exhibit 1 pair cells, each pack, with severe "self discharge"
"Optimal" voltages rated at:
>3.70-4.05V best usable capacity ~300% usable cycles
>3.70-3.90V maximum life 800% usable cycles

file.php


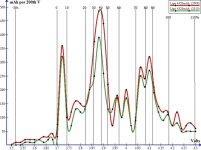
2008 & 2010 Dell laptop recycled LiPo - 3.7V 4320mAh (2p) cells
Somewhat different formulation than the 2004-2006 version
Most noticeable is the capacity shift towards 3.70V
"Optimal" voltages rated at:
>3.70-4.15V best usable capacity ~150% usable cycles
>3.70-4.02V maximum life ~400% usable cycles

file.php


Finally tested up some RC Lipo ...

WinForce 3.7V 5700mAh (20C) RC LiPo
Most remarkable is the expansive voltage range of good capacity
"Optimal" voltages rated at:
>3.55-<4.20V best usable capacity ~100% usable cycles
>3.55-3.90V maximum life ~800% usable cycles
(These cells look to be "the perfect" specimens for a 3.90V charge limit ... ~70% capacity with 800% usable cycles! - age deterioration unknown?)

file.php


Winners Circle 3.7V 2000mAh 10C) RC LiPo
Solid capacity with no drastic capacity dips
Several years old with minimal cells gone bad(12 3s packs with 0% self discharging cells!)
"Optimal" voltages rated at:
>3.70-4.15V best usable capacity ~150% usable cycles
>3.70-3.95V maximum life >500% usable cycles

file.php


My purpose in mapping is to determine voltage regions for most efficient use combined with maximum lifespan.
Best exampled is that deep discharges "stress" cells with a miniscule capacity addition.


Every brand - type - formulation of Lithium cell "maps" differently!
 
Finally tested one of the Sony LiPo cells from the metal topped Dell Media Bay Batteries

"Ver 2" SONY 11.1V 4320mAh (3s2p) LiPo Laptop Cells
>3.70V to 4.20V looks like a good voltage range
>3.75V to 4.02V for 350% life cycles?
Pack was in very good condition >90% capacity, with excellent equalization at max DOD and fully charged!

Sony Lipo 4320 ver2.jpg
 
Just noticed the graphing program has an area-volume function.

3.65V to 4.20V = 95 95/95 = 100% capacity ~300 charge-discharge cycles?

View attachment 3
Oops! Shading does not transfer in jpgs ... sorry.
3.65V to 4.14V = 90 90/95 = 95% capacity ~425+ charge-discharge cycles?

95%.jpg

3.65V to 4.06V = 81 81/95 = 85% capacity ~750+ charge-discharge cycles?

85%.jpg

3.65V to 4.02V = 81 81/95 = 75% capacity ~1600+ charge-discharge cycles?


Note: Moving DOD from 3.65 to 3.68V loses ~1% additional
Moving DOD from 3.65 to 3.70V loses ~3% additional
 
I'm wondering if the location of the peaks/valleys can tell you something about the condition of the cells?

Maybe try testing some known bad cells to see if there is an obvious shape difference.

It also seems like if you took the first derivative of a "normal" graph, you should get the same kind of information. Here's a factory Sanyo graph:
Sanyo UR18650W Discharge Graph.jpg
 
Graphing program has an area-volume function.
This allows determining % capacity to be determined for specific (static) voltages.
This map is for my present LiPo ... cell of choice (2010 - green line).

file.php


I mapped to 4.18V as 100% capacity due to numerical ease of figuring graph data.
Presently bulk charging to 4.14V but may adjust to 4.12V as more optimal.
Below 3.7V demonstrates mere seconds of feeble capacity for the resultant severe damage.

My purpose in engaging in capacity mapping is to determine optimal charge-discharge voltages and to help determine a capacity vs lifespan comparison.
 

Attachments

  • Lipo 4320 Fuel Gauge.jpg
    Lipo 4320 Fuel Gauge.jpg
    53.5 KB · Views: 5,837
Updated LiPo Capacity Maps
and ... some interesting observations!

file.php


Winners Circle 2000mAh cells perform more evenly than any others I've tested.
After testing each cell, self-discharge, IR, capacity ... I built a 6s2p 22.2V 4Ah B&D Firestorm power tool pack, replacing 24V 1.6Ah NiCd.
Pack powers the 7¼" power saw nicely, haven't tested the Hammer Drill or Sawzall under load yet.


The "20C" WinForce 5700mAh RC Lipo seems an ideal candidate for charging to 3.90V for a reputed 800% usable life cycles.
At a 70% of mapped capacity!!!
An interesting departure from the other LiPo (and 18650 laptop cells) that seem "empty" near 3.70V.

The 4320 LiPo (2010) seems fairly unique, with a massive capacity bulge near 4.12V.
I have been charging to 4.14V ... but may revise to 4.12V.
My preliminary determination of charging to only 4.02V seems unnecessary.

Unnecessary ... in that the extreme additional lifespan sacrifices a substantial capacity bulge that seems designed for and in want of being used.

As a "self justification" ... I estimate that my quick about town errands use less than 5Ah.
This means that if I charge immediately after each little "run" ... discharge-charge remains tightly within the 4.05-4.12V bulge.

Now ... Hypothetically ... cell damage-wear-deterioration is due to voltage range ...
additional .1V charge cutting cycle life in half ...
additional discharge depth damaging cycle life.

To the best of my acquired understanding ...
The electrons are stored in a carbon-graphite lattice.
As electrons are added-subtracted , the lattice expands-contracts somewhat ... causing cracks and occasional collapse ... hence the gradual capacity deterioration.
Limiting voltage range to the voltage range of best capacity ... likely-hopefully would result in the least flexing = least deterioration for amount of usable capacity.
If amount of "flex" is due to voltage rather than capacity (As seem likely) then keeping use to within these energy rich regions should increase usable life better than lowering voltage! ... ???
 
I realized that the graph program was not precisely representing my results.
Values are the result of measurement from .02V below marked values.

Dell Media Bay LiPo (unbranded)

2010 Lipo 4320 (Dell).jpg

A bar graph function is necessary to more accurately present my measurements.
Sadly, program does not provide such ...
So I used "paint" to make a rough conversion.


All my other "Capacity Maps" should be similarly ... adjusted, to be more precisely accurate.
 
One thing I wondered about was could the rate of charge (current) affect the discharge map?
I was thinking when I watch my BC168 cell charger it often flicks around the amps up and down depending on the specific cell.
If you are bulk charging then your not really gently topping off the charge like at least the BC168 charger would, maybe where and when current gets shoved into the battery affects its discharge map?
 
TheBeastie said:
One thing I wondered about was could the rate of charge (current) affect the discharge map?
I was thinking when I watch my BC168 cell charger it often flicks around the amps up and down depending on the specific cell.
If you are bulk charging then your not really gently topping off the charge like at least the BC168 charger would, maybe where and when current gets shoved into the battery affects its discharge map?
Well 1st ...
These are capacity maps ... not discharge maps


Bulk Charging, via a CC\CV charger does gently top off the battery charge.
At "full", a bulk charger slowly reduces current till an effective 0A, can't get any more gentle than that ! ... ?

The MeanWell S-150 Series, for example, allows adjusting current, and voltage, precisely.
The charge begins at the full set Amps and a reduced voltage.
Current - Amps stays precisely at this set value until target voltage is attained.
After set voltage is attained current - Amps begins diminishing till a near 0 Amps is attained.
Reaching a true 0 amps would take forever or some analogous fluctuation, but with any pack, (free of self discharging cells), a bulk charger effectively provides consistent charging with a trickle-maintenance function.
For Li-ion-LiPo (LiCo) ... Not true for LiFe Lithium iron unless voltage is set low and timered or monitored!!!

Found a nice item!
Small Volt - Amp meter, applicable to most chargers. < $5

30V 10A


100V 10A

With the addition of a pot to the R33 you can have a simple, fully adjustable, CC\CV charger.
I plan on building several variants with MeanWell S-150-24's.
EG 5s (21V 7.14A) - 7s (29.4V 5.10A) charger
I also intend to implement dual 24V 40mm fans run in series as very quiet, effective, cooling.
See - MeanWell Mods - S-150-24
 

Attachments

  • VAmeter.JPG
    VAmeter.JPG
    31.2 KB · Views: 5,740
Dude, I have been looking for good data like this forever. The only way I was able to get this kind of stuff was to make a profile on the old MACCOR machines at work. Thanks so much for compiling and performing these tests.

I've said it before, but reliability and longevity is key to making the electric revolution work. The longer you can keep the most expensive part of the bike, the cheaper it is per mile, and the more sense it makes.

I have been charging to 4.13VPC for quite a while, and with the amount of capacity that I have, I can probably back off quite a bit from there.
 
good stuff DA..
Have you been able to run repeated tests on identical cells to be sure these profiles are indeed a characteristic of the type/make of cell, rather than just isolated to individual cells for some unknown reason. ?
If so, how closely do they compare cell to cell ?
 
Hillhater said:
good stuff DA..
Have you been able to run repeated tests on identical cells to be sure these profiles are indeed a characteristic of the type/make of cell, rather than just isolated to individual cells for some unknown reason. ?
If so, how closely do they compare cell to cell ?
2004 Lipo and 2006 Lipo were used, in very good condition.
2008 and 2010 Lipo were new Old Stock, never opened, from factory packaging.
All were tested as 3s2p, with good equalization among all cells from "empty-" to "full+".

Winforce and Winners Circle were likewise tested 3s1p from equalized empty to respectably equal at full.

So, all brands-samples were tested of 3 to 6 samples and were reasonably identical results for each sample, within each type.

I feel the results-graphs to be accurate maps ... accurate to within a few percentage points ... but only for the specific brand and version of cell!
 
Others, apparently have been using a method, similar to mine, for "mapping" battery capacity.

I was able to find their "maps" for certain Lithium variants.

file.php


Most impressively, they mapped charge and discharge cycles!
Charge "current density " on top half of graph ...
Discharge "current density " on bottom half of graph.
Graph line "shift is a function of IR and would vary, dependent on tests C rate.
I did not note charge and discharge C rates. ... sorry!

they use the term Current Density
 

Attachments

  • Li energy density.jpg
    Li energy density.jpg
    45.8 KB · Views: 5,549
I have previously noted that specific chemical formulations of Lithium cells produce differing optimal discharge voltages.
This minimal discharge rate graph indicate 3 distinct optimal discharge voltage points. (18650 cells)

Capacity-0.2A.jpg
Red - Most common have reasonably steady output till 3.6V
Green - Loses reasonable use at ~3.4V
Blue - With the highest capacity, has decent output till ~3.2V

This seems to indicate 3 distinctly separate "formulations", each with their own specific optimal discharge voltages.

Discharging deeper supplies minimal mAh of saggy-pitiful voltage. And likely ... inflicts excessive cell damage for minimal return!

Note: this graph was made at a .2A discharge rate, so optimal discharge voltages are near the cells true resting voltages rather than the cell readings under typical discharge rates.
After determining your cells optimal discharged voltage, take cells to that point, apply typical discharge rate, note voltage sag and determine that as pack "empty" voltage during "typical use".
 
DrkAngel said:
Sanyo 2600mAh (3.6V 5200mAh -2p)
Very common
Quality varies, Some batches display good pack equalization, other batches exhibit 1 pair cells, each pack, with severe "self discharge"
"Optimal" voltages rated at:
>3.70-4.05V best usable capacity ~300% usable cycles
>3.70-3.90V maximum life 800% usable cycles

file.php
Discharge map for same cell ... for comparison ...

file.php


Reversed Capacity map for direct comparison:
 
More evident to some ... on the "typical" discharge graph. - I added vertical lines to highlight capacity per 1/10V during discharge
(3.00, 2.90 & 2.80V lines overlap ... capacity less than line width)

file.php


Above graph confirms (to me) of 3.50V as optimal alarm and end of discharge point (@5C - black line ). (3.60V might greatly increase life and safety ... if sufficient battery capacity?)
Should be reasonably comparable to 20C Lipo.
8Ah at 5C = 40A (Controller rated Amps? or maximum sustained?)
At less than 40A, 3.60V alarm set would be a more appropriate choice.
 
It is possible to build a capacity map of any cell from its discharge graph.
1st I used MS Paint to draw in 1/10V lines
2nd drew vertical lines from selected discharge line at .1V intersections
3rd estimated .05V increments and added line - for better resolution

Sanyo 18650 laptop cell discharge capacity map

Sanyo Discharge Capacity Map.jpg

For alarm set or voltage fuel gauge

Would recommend:
3.60V as "empty" at mild rate discharge (.2C)
3.50V as "empty" at moderate rate discharge (.5C)
3.30V+ as "empty" at heavy rate discharge (1C)
 
file.php


Using graph I built a discharge map.
(Based on .2A <.1C discharge rate line)
Scaled in Wh rather than my typical mAh ... sorry.

In "Paint" I "enlarged", added .05V lines, "scaled" 1/10th increments to 0 to 1, copied and pasted and dragged to carefully measure discharge line intersections with various voltage increments.


2.80 = .04
2.85 = .04
2.90 = .04
2.95 = .05
3.00 = .07
3.05 = .07
3.10 = .08
3.15 = .08
3.20 = .07
3.25 = .07
3.30 = <.1
3.35 = .1
3.40 =.1
3.45 = .45
3.50 = .4
3.55 = .4
3.60 = .7
3.65 = .85
3.70 = .6
3.75 = .55
3.80 = .35
3.85 = .5
3.90 = .5
3.95 = .6
4.00 = .35
4.05 = .4
4.10 = 1.0
4.15 = .3
4.20 = <.1wh

Bar graph would be more accurate, actual capacity would be a horizontal line to the lower .05V.


file.php


Shows good capacity from 3.40V till initial sag below 4.20V.
Displays similar hills and valleys to various other of my "mapped" LiPo.

IN|R18650-25 Capacity Bar Graph from .2C discharge graph

file.php


Between 3.40V and 4.10V appears optimal for best usable capacity with least "wear and tear" ... IMO ...
 

Attachments

  • Samsung INR18650-25R 2500mAh (Cyan)-Energy.jpg
    Samsung INR18650-25R 2500mAh (Cyan)-Energy.jpg
    73.5 KB · Views: 5,078
Found Charge\Discharge Capacity maps for Some Panasonic, typical Sayno and ridiculous-worthless UltraFire
Maps were made with a modest 1A charge and 1A discharge

Capacity map CvsD.jpg
 
DrkAngel said:
Using graph I built a discharge map.
(Based on .2A <.1C discharge rate line)
Scaled in Wh rather than my typical mAh ... sorry.
That's pretty cool, I would love to see you do such a discharge map of the Samsung 29E as I have a 12S7P pack built out of those..
 
Using Samsung INR18650-29E discharge graph ...
file.php


Using .2A discharge line, I was able to roughly map cell capacity.
  • Method - I:
  • used "paint"
  • added .05V graduations
  • resized to equalize pixel count to graduated measure.
  • went 300% size to precisely gauge

file.php


and transferred data to graph.

file.php


Being derived from a low discharge graph ...
I would roughly estimate optimal charged voltage as ≤4.15V and optimal static DOD as >3.20V (Higher resolution at lower (.1A) discharge rate needed to better determine capacity map and optimal static voltages!)
 
Building my next battery packs using Sony LiPo.

file.php


I decided to precisely map charged capacity at specific voltages ...

file.php


These cells look excellent for prolonged usable life by reducing charged voltage!
 

Attachments

  • Sony Lipo 4320 ver 2%.jpg
    Sony Lipo 4320 ver 2%.jpg
    57.2 KB · Views: 3,143
Accidentally got into Black & Decker 20V Max cordless power tools.
(Porter Cable uses same battery with different notches)
Picked up a reciprocating saw w/battery at the local thrift shop for $10.
No charger, so I bought the drill w/battery & charger for an additional $52.

Charged up both batteries and disassembled to examine cells.
Pack metered at 20.46V = 4.092V per cell.
20V Max use 5 x 3.6-3.7V 18650 cells but rate them at "20V Max" rather than the old 18V or 18.5V "standard".
Dull red (Sanyo) cells were precise at 4.092V each = good charge-balance circuitry?
Voltages were the same with my new (2016) and old (2013) battery packs.


B&D_LBXR20%20_5.JPG


I further purchased the yard kit (used on eBay) for $51 and received additional charger and battery.
(Weed eater and blower)
Varied chargers and batteries but maintained a consistent 20.40-20.46v charged voltage.
This indicates a < 4.10V designed charged voltage!
Possibly as a charge safety margin, but most likely they recognize the life and performance extending benefits!
Basic charger is a 10w, for an approximate 3.5 hour full charge. (.33C charge rate)
2.0Ah packs available.

Also interesting is the notable lack (after 6 years on the market) of any "repair or parts" battery packs available.
(Just spotted picture of B&D 20V Max battery dated 2010!

A glaring testament to the improved durability from reduced charge voltage! ... ?
(I built a 22.2V 21.6Ah hip pack and need bad 20V Max pack to build quick connect.)

PS Drill was the Matrix model that swaps modules, also bought the impact driver module for $30.
PSS Home Depot had a "deal" I couldn't resist! B&D Kit w/Circular Saw, Reciprocating Saw, drill, Light, Charger and 2 Batteries + Bag for $99 w/$10 discount for $89 ... added $12 for additional 2 year warranty and $8 tax = $109 w/4year warranty! - Still on sale but sold out on line ... might get new stock before sale ends?
 
Back
Top