
You are using an out of date browser. It may not display this or other websites correctly.
You should upgrade or use an alternative browser.
You should upgrade or use an alternative browser.
Cycle Analyst Trip Analysis Software (now Online Sharing!)
- Thread starter justin_le
- Start date
Ascoro said:We bought a couple of cheap Bluetooth heart rate monitors, and if I could find a decent app to actually record the data and not just show the current rate, then that would also make for an interesting overlay. Had any thoughts of adding Bluetooth to future versions of either the CA or logger for bio-sensors like this?
If we have a bluetooth module on the CA it would initially be more for streaming the data output and updating the CA's parameters, not for receiving data from other devices. However, if you can log the heartrate info (surely there would be some program for that!) in either a 1Hz or 5Hz data rate to match the CA's data rate, then you should be able to copy and paste this as a data column in excel, replacing one of the fields from the CA that you aren't using (like the accelleration column), and then save it again as a CSV file. When you upload it to the analyzer then the ACC button would give your heart-rate graph.
-Justin
Ascoro said:Hey Justin, the elevation doesn't seem to be working on the graph. I thought it was my mates logger, but its not showing elevations on previous files that did show it...
Sorry about that, there was a bug introduced during some of the more recent updates but it should be fixed again now, so thanks for the heads up.
OK, Time for a few more updates:
http://www.ebikes.ca/tripanalyzer/index.php
Small items include making the frames for the file upload, map, and graph sections closer together in order to better fit everything on a screen without vertical scrolling. And, the area on the right for the "Section Stats" has been cleaned up so that the numbers and units are on the same line, freeing up a bunch of room. This is a prelude to us having more stats here, likely divvied up into 3 groups. One for section details (elevatation gain/loss, distance, total Ah, % regen etc), one for average values (Wh/km, average speed, average grade etc.), and a final group for peak values within that section (maximum speed, maximum power, etc).
View attachment 2
Big item is that we've got our first implementation of the file upload and share functionality. Button is on the bottom left, and is only active if you have loaded a local file,

You can use the scroll bars to choose the section of the trip that you want to upload, and then once the upload has finished it will spit out a URL that will then provide a direct link to this trip data from anywhere. So in the above file, I zoomed in on a ~9km hilly section through Los Gatos where my motor temperature got up to 130 Celcius, and if you click on this link you should be able to see that part of the trip and choose with graphs show up etc:
http://www.ebikes.ca/tripanalyzer/index.php?trip=VBH0bO

We're working on updates to have the graphs display and load faster, and also updates to include the selected plots to load by default from the shared link and that way you can have it appear exactly the same way.
http://www.ebikes.ca/tripanalyzer/index.php
Small items include making the frames for the file upload, map, and graph sections closer together in order to better fit everything on a screen without vertical scrolling. And, the area on the right for the "Section Stats" has been cleaned up so that the numbers and units are on the same line, freeing up a bunch of room. This is a prelude to us having more stats here, likely divvied up into 3 groups. One for section details (elevatation gain/loss, distance, total Ah, % regen etc), one for average values (Wh/km, average speed, average grade etc.), and a final group for peak values within that section (maximum speed, maximum power, etc).
View attachment 2
Big item is that we've got our first implementation of the file upload and share functionality. Button is on the bottom left, and is only active if you have loaded a local file,
You can use the scroll bars to choose the section of the trip that you want to upload, and then once the upload has finished it will spit out a URL that will then provide a direct link to this trip data from anywhere. So in the above file, I zoomed in on a ~9km hilly section through Los Gatos where my motor temperature got up to 130 Celcius, and if you click on this link you should be able to see that part of the trip and choose with graphs show up etc:
http://www.ebikes.ca/tripanalyzer/index.php?trip=VBH0bO
We're working on updates to have the graphs display and load faster, and also updates to include the selected plots to load by default from the shared link and that way you can have it appear exactly the same way.
justin_le said:if you can log the heartrate info (surely there would be some program for that!) in either a 1Hz or 5Hz data rate to match the CA's data rate, then you should be able to copy and paste this as a data column in excel
Yes, good idea... will have a play with that!
New updates are good, the 'upload and share' is useful (and elevation is working again).
Wishlist - Provision for those with a dual monitor setup would be great - map on one screen and graph on the other (option for two windows somehow?).
Bug - Not sure why, but the page content is all over to the right hand side of the window now, not centered like it was (Chrome).
A tip for any logger users - an easy way to combine multiple log files together is to make a simple windows batch file with the following command in it -
copy CA*.txt CA-Combined.txt
copy GPS*.txt GPS-Combined.txt
(A batch file is just a .txt file renamed to .bat)
Put the batch file in the folder where you log file pairs are and run (double click) the batch file. This will make a 'CA-Combined.txt' file and a 'GPS-Combined.txt' file suitable for uploading. A work around until Justin (and crew) implement their own more sophisticated version on the analyzer!
Here's a combined one off my mates bike from Saturday (about 25 pairs of files) - http://ebikes.ca/tripanalyzer/index.php?trip=OzJ9r2
gammaray
10 W
Ascoro said:justin_le said:if you can log the heartrate info (surely there would be some program for that!) in either a 1Hz or 5Hz data rate to match the CA's data rate, then you should be able to copy and paste this as a data column in excel
Yes, good idea... will have a play with that!
New updates are good, the 'upload and share' is useful (and elevation is working again).
Wishlist - Provision for those with a dual monitor setup would be great - map on one screen and graph on the other (option for two windows somehow?).
Bug - Not sure why, but the page content is all over to the right hand side of the window now, not centered like it was (Chrome).
Hi Ascoro, I am one of the software developers working with Justin on the Trip Analyzer for the Cycle Analyst and I was wondering if you could give me more details about the bug you just encountered.
Please provide a screenshot of the bug as it would be very helpful to us.
Which operating system are you using?
Which version of Google Chrome are you using? Go to: chrome://chrome/ to find out.
Did this alignment issue occur in previous revisions of the Trip Analyzer?
gammaray said:Please provide a screenshot of the bug as it would be very helpful to us.
Which operating system are you using?
Which version of Google Chrome are you using? Go to: chrome://chrome/ to find out.
Did this alignment issue occur in previous revisions of the Trip Analyzer?
Hi Gammaray,
It seems to behave on my work PC this morning (also Chrome, Version 35.0.1916.153 m). I'll check my laptop again tonight, not sure what Chrome version is on that. Both are Win7 (Pro at work, Home Premium on laptop). And no, the alignment was fine a couple of days ago when I used it from that laptop.
Weird, still does it on the laptop even after a forced page refresh - Chrome Version 35.0.1916.153 m / Win 7 Home Premium / Acer Aspire laptop
Same in IE11 version 11.0.9600.17126 after a page refresh. It was almost right on my work Dell destop, the map and graph windows were only a little off to the right.

Same in IE11 version 11.0.9600.17126 after a page refresh. It was almost right on my work Dell destop, the map and graph windows were only a little off to the right.
gammaray
10 W
Ascoro said:Weird, still does it on the laptop even after a forced page refresh - Chrome Version 35.0.1916.153 m / Win 7 Home Premium / Acer Aspire laptop
Same in IE11 version 11.0.9600.17126 after a page refresh. It was almost right on my work Dell destop, the map and graph windows were only a little off to the right.
Thanks very much for the screenshot. I have identified and resolved the issue. You should no longer have any alignment issues as soon as you clear your cache.
Instead of clearing your browsers cache, you can alternatively and easily press the "Clear Trip" button which will force the browser to clear the cache for the Trip Analyzer.
Ascoro said:Wishlist - Provision for those with a dual monitor setup would be great - map on one screen and graph on the other (option for two windows somehow?).
Hmm, so we had a good chat about this. As a native application it would be trivial, but since we are developing this as a client side web app that runs in your browser there are a lot of limitation in what we can do. This might be possible if we have the map show up in a separate pop-up window and have both the graph plots and the map communicating to each other via our server. But then the application would be dependent on a server connection which has some downsides for uptime and reliability etc. Anyways it's a possible enhancement we'll keep in mind for sure.
Has anybody else been trying the trip upload and sharing feature?
gammaray said:I have identified and resolved the issue.
Yep, it is nicely centered in the browser on my work PC now. Will check the laptop tonight.
justin_le said:this as a client side web app that runs in your browser there are a lot of limitation in what we can do
Yes, understand.
justin_le said:Has anybody else been trying the trip upload and sharing feature?
I introduced my mate to this today, so he's been playing with it too. "Awesome" was his comment - it's nice to be able to select certain sections and 'export' to show others... good feature.
Wishlist - Ability to change the colours of the graph plots. Some colours currently are very similar to each other, and when you are only showing two or three data components it would be useful to be able to change colours that are too similar (like Elevation and H RPM)
Wishlist - Ability to name or describe sections of a complete track. For instance, 'tag' 0.0km - 4.5km as "Going hell for leather", 4.5km - 10km as "Riding with Bob on his 36v bike". This occurred to me last night, as my ride was pretty much as above. The plots show a distinct difference and it would be nice to tag the sections before sharing so people can interpret the difference.
GPS - I know GPS data is at the whim of the satellites and how many are locked on, but I get some odd elevation readings sometimes.
I know my house elevation, and when we started a ride the other weekend this was pretty well spot on. But when we got to the coast and were sitting on a bench maybe 10m above sea level, the logger is reporting us as being at -30m! There was some cloud cover, but not overly thick. It seems to have gone wayward as the trip progressed - http://ebikes.ca/tripanalyzer/index.php?trip=ULzgVL
The area around 'Big Carine Swamp' is (in reality) approx 4m ASL as a reference.
I have the logger mounted on my top bar, just forward of the saddle, so it has a clear view of the sky. My controller (Grinfineon) is externally mounted, and sits right below the logger so not sure if there is some sort of effect from this. I will try it (the logger) in another position and see what happens... will also make note of weather conditions, perhaps just getting a poor signal on some days.
Ascoro said:Wishlist - Ability to change the colours of the graph plots. Some colours currently are very similar to each other, and when you are only showing two or three data components it would be useful to be able to change colours that are too similar (like Elevation and H RPM)
Yes, this and also setting which 'Y' axis a particular plot is displayed on, since sometimes with particular pairs of plots the autoscaling doesn't work so well at showing simultaneous data pairs that happened to be mapped to the same axis.
Wishlist - Ability to name or describe sections of a complete track. For instance, 'tag' 0.0km - 4.5km as "Going hell for leather", 4.5km - 10km as "Riding with Bob on his 36v bike". This occurred to me last night, as my ride was pretty much as above. The plots show a distinct difference and it would be nice to tag the sections before sharing so people can interpret the difference.
That's a great idea that we hadn't really considered yet. Adding embedded comments and/or tags to different points on the trip could really help in the way most people would be using it, to showcase different features or observations on a ride. Thanks for the suggestion and we'll put this on the rollout plans.
Ascoro said:GPS - I know GPS data is at the whim of the satellites and how many are locked on, but I get some odd elevation readings sometimes.
I know my house elevation, and when we started a ride the other weekend this was pretty well spot on. But when we got to the coast and were sitting on a bench maybe 10m above sea level, the logger is reporting us as being at -30m! There was some cloud cover, but not overly thick. It seems to have gone wayward as the trip progressed - http://ebikes.ca/tripanalyzer/index.php?trip=ULzgVL
The area around 'Big Carine Swamp' is (in reality) approx 4m ASL as a reference.
Hmm, we've seen a lot of wonky elevation data in areas around tall buildings, overpasses etc., but this looks like a much more gradual and consistent offset. The GPS elevation is generally about 10x less certain than the lat and longitude, but it's odd to see it veer steadily this far off. The GPS file shows how many satellites have a fix (refer to the NMEA spec), is it possible to look at that and let us know the satellite fix count, or just attach the GPS file here?
We spent a bit of time looking into ways of getting the elevation plot from google maps API rather than the GPS data, since this would be a lot less susceptible to GPS errors and noise, but there's only a limited amount of requests we can ask for per day as a free platform and we'd quickly hit this point once a few people started using it.
It appears to have 15/16 satellites in view consistently throughout the file, but does that mean locked on? I know with my Garmin handheld it often 'sees' more than it can lock to, but regardless it should get a good elevation fix with just 5 well spread satellites locked on - more is better of course. But vertical accuracy is 3 times horizontal accuracy in general, so I'm told today. Consumer GPS is at best 5m, so perhaps the variations are just something we have to live with.
GPS log attached for your to look through...
GPS log attached for your to look through...
Attachments
gammaray
10 W
Ascoro said:It appears to have 15/16 satellites in view consistently throughout the file, but does that mean locked on?
Within your GPS file, you should see a bunch of lines that the GPS unit was logging. The one we care about is the $GPGGA line.
After looking over your file, it seems like you do have a lock most of the time (I quickly scanned through the file, not verified by software).
eg. $GPGGA,hhmmss.ss,llll.ll,a,yyyyy.yy,a,x,xx,x.x,x.x,M,x.x,M,x.x,xxxx
hhmmss.ss = UTC of position
llll.ll = latitude of position
a = N or S
yyyyy.yy = Longitude of position
a = E or W
x = GPS Quality indicator (0=no fix, 1=GPS fix, 2=Dif. GPS fix) << This is a one you are looking for
xx = number of satellites in use
x.x = horizontal dilution of precision
x.x = Antenna altitude above mean-sea-level
M = units of antenna altitude, meters
x.x = Geoidal separation
M = units of geoidal separation, meters
x.x = Age of Differential GPS data (seconds)
xxxx = Differential reference station ID
If you have any other questions, feel free to ask.
Gammaray has been hard at work the past few days. The latest update pushes the following changes:
1) The process of loading large CA files is a lot faster now. We have a lot of analogger data from the ebike touring trips that are upwards of 5+ MB in size. It used to be that the map would show up relatively fast, but the graph would take many 10's of seconds to load. It's now about 5 times quicker for the graphs to show up.
2) If you upload and share trip data, it will remember the selected graphs so the same view will show up from the URL link as what you see when you upload. For instance, click on this
http://www.ebikes.ca/tripanalyzer/index.php?trip=9Nx1IP
And you should see amps, speed, and elevation all preselected.
Ascoro said:Another little 'nice to have' feature would be a button to reset the section range boxes back to full extents instead of dragging / typing.
Implemented, as a "maximize" button

justin_le said:Ascoro said:Wishlist - Ability to name or describe sections of a complete track. For instance, 'tag' 0.0km - 4.5km as "Going hell for leather", 4.5km - 10km as "Riding with Bob on his 36v bike". This occurred to me last night, as my ride was pretty much as above. The plots show a distinct difference and it would be nice to tag the sections before sharing so people can interpret the difference.
That's a great idea that we hadn't really considered yet. Adding embedded comments and/or tags to different points on the trip could really help in the way most people would be using it, to showcase different features or observations on a ride. Thanks for the suggestion and we'll put this on the rollout plans.
Here you have it Ascoro. In addition to the "Upload and Share" function, you can now apply a named label to any segment of the trip.


Each time you name a section, a button shows up on the bottom which will automatically set the range to labelled region. Then, when you hit 'upload and share', any named sections that are inside the zone which you upload will also be preserved in the shared link. If you go to the URL here for instance:
http://www.ebikes.ca/tools/trip-analyzer.html?trip=FSaVU7
You should see a trip loaded with 5 different pre-named sections illustrating this.

We'll plan to have a more visual means of showing the section views on the graph itself so you can see in advance which region of the trip it will take you to, but for now at least the core functionality is implemented for people to play with

NeilP
1 GW
Subscribed ...nice.
Saves all this mucking about with Logview Studio
Saves all this mucking about with Logview Studio
justin_le said:Alright guys, time to check out the latest batch of enhancements here:
http://www.ebikes.ca/tripanalyzer/index.html
If you had it loaded previously, you might want to refresh the browser to clear any local caching.
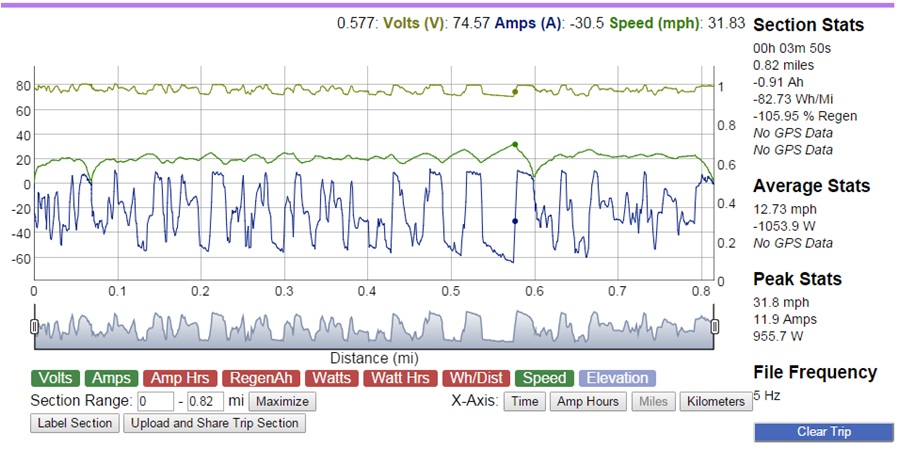
Now, when you zoom in on a section of the graph, you can see the corresponding route segment in blue on the GPS map, and on the right pane is a set trip statistics over this region. Like the elevation gain, avg %grade, average wh/km, % regen etc. It should work fine both with 1Hz and 5Hz data rates.
We're still working on having it show an elevation plot as well, that should be ready in the next update. We're also working on a toggle switch so you can choose between a distance or amp-hour for the 'X' axis. Showing the plot versus Ah is very useful for creating battery discharge graphs with the CA data where you don't have a speedo hooked up. Any other key stats overlooked people would want to see here?
Hi Justin
This is my first post on Endless-sphere.com. I wanted to congratulate you on the development of the CA V3 and the Analogger which have enabled me to build a recumbent trike for the rehabilitation of a wheelchair user. Your technology, coupled with the Thun Torque Sensing Bottom Bracket, has made the collection and analysis of trials data possible.
I am particularly excited to study how the rider’s torque and Human Wattage increases as he builds his muscles and stretches his ligaments. The recumbent, which I have called MAD MAXe, also makes possibly a really interesting and fun form of exercise for wheelchair users.
The basic trike is a folding tadpole recumbent with a Crystalyte RHT3525 rear hub motor, a Grin 20A controller, a CA V3 with Analogger all powered from a Golden Motor 48V LiFePO4 11aH battery pack. I use the reverse facility on the Grin controller as well as maximum regenerative braking when activating either the front drum brakes or the rear wheel V brake. We also use the temperature sensing capability of the CA V3. The only mechanical job left to complete before data collection trials get under way is the installation of a friction thumb brake using a 2:1 combiner for the rear V brake and an accessory bar to hold cameras etc just behind the rider. With this set up the max speed is circa 23-25 MPH.
Without the CA V3 and the Analogger this project would have been great fun, but with the CA V3 and Analogger we now have a powerful diagnostic capability that should make a real difference to many disabled people.
Fabulous work.
Hey Mad Max and sorry that I missed seeing this post earlier. Thanks quite a bit for the feeback, you're usage of these tools is pretty much exactly what we've been hoping people would be able to do with them. I realize that the numeric data on our trip analyzer doesn't yet do any computations on the human power statistics, like the average cadence, average watts, calories burned etc. That shouldn't be too difficult to add, although the data from the THUN sensor itself has a bit too much drift to give a confident human wattage figure at lower power levels. Do you find that it is good enough for your application needs in rehabilitation?
If you do collect any interesting test data from your experiments please do post and share it, I'm quite interested to see how this information gets used and applied in real world cases.
If you do collect any interesting test data from your experiments please do post and share it, I'm quite interested to see how this information gets used and applied in real world cases.
Hi Justine - my turn to apologize for the delay in responding to your reply, I have been busy traveling with no chance to check endless-sphere. The e-Trike has been shown to operate as expected but I have had some issues with my primary subject - his ligaments are so tight he will require a fair amount of additional physio to be able to pedal once again. He was able to cycle on a conventional trike before going to university. Now that he has obtained his BA and MA degrees and enjoyed university life for 4 years, we need to help him build his muscles and stretch his ligaments just to get him comfortable on the e-Trike. He has now ridden the e-Trike using 'throttle over ride mode' in order to exercise his arms while steering the e-Trike. He loved the freedom and the excitement of the e-Trike but I should have limited his speed on his first run - I had meant to do so but I also got carried away by the excitement. I was last seen running at great speed yelling instructions to the subject to take his finger off the throttle! Since these early trials in late August I have been invited to talk on the rehabilitation possibilities of the e-Trike for wheelchair users at a Ubiquitous Computing Conference in Belfast. This conference is to be held in early December this year. The conference is sponsored by the UK IET of which I am a Fellow. I have also agreed to display the e-Trike as people are really fascinated by what looks like something from Mad Max. In my talk I will cover aspects of the e-Trike's design philosophy and how the various requirements have been met. The e-Trike has been under development for many years (a recumbent folding e-Trike) but it has been the availability of the THUN Torque sensor and the Cycle Analyst V3 which really helped move this project forward very quickly. During my talk in Belfast I will also be showing footage of the e-Trike in action as well as footage taken from the GoPro camera mounted on the seat frame looking over the riders shoulder. I also intend to display the data obtained from the e-Trikes CA GPS Data logger. The issue about human wattage figures at low power levels has yet to be looked at in detail - my main concern is at least to be able to track and show improvement over time as muscles develop and the resistance created by tight ligaments is gradually reduced. This has been a journey that has taken many years to come to fruition but now we have a test vehicle that has already given insights into rehabilitation challenges. One of the key issues is to recognize that not all wheelchair users have the same problems and that motivation and expectation management are vital issues needing to be addressed. I have fixed small Canadian, German and British flags on the front of the e-Trike to acknowledge the contributions made by many people from these countries. The Canadian flag is for you and your team who have worked on the CA V3 and the analogger. You guys are doing a great job and you would always be welcome to visit us here in West London.
EEDan1010101
100 µW
- Joined
- Oct 22, 2014
- Messages
- 9
Can anyone help me out. The trip analyzer does not let me view acceleration or torque data. There is no option under my graph why?
Similar threads
- Replies
- 3
- Views
- 1,796
- Replies
- 3
- Views
- 604
- Replies
- 4,851
- Views
- 1,107,332
- Replies
- 5
- Views
- 876