Here is how much capacity is in Lipo from 4.1V to 4.2V

mvly

10 kW
Joined
May 25, 2011
Messages
916
I did this test accidentally.

I usually charge my nanotech from 3.7V to 4.1V. Since it's a 14s battery, I have a 10s set and 4s set. I break them up when charging. When charging both at 7.5A on my icharger 1010b+, I would get very close capacity when charging them. Typically it's around 13Ah. Well one day I set the 4s charger to charge to 4.2V. It turns out, I got around 1.7Ah difference between the 4.1V and 4.2V battery. Just to verify, I reset the 10s and then set it to 4.2V and continue the charge and it was 1.7Ah also. So indeed it's 1.7Ah. Keep in mind, I have a 22Ah Lipo setup.

So:
1.7Ah/22Ah = 7.7% additional.

I didn't check the bottom end, i.e. How much Ah is in 3.7V to 3.0V. I suspect it similar.

So you can considered 16% of your Lipo capacity is used to keep your Lipo pack running longer.
 
mvly said:
I usually charge my nanotech from 3.7V to 4.1V. Since it's a 14s battery, I have a 10s set and 4s set. I break them up when charging. When charging both at 7.5A on my icharger 1010b+, I would get very close capacity when charging them. Typically it's around 13Ah. Well one day I set the 4s charger to charge to 4.2V. It turns out, I got around 1.7Ah difference between the 4.1V and 4.2V battery. Just to verify, I reset the 10s and then set it to 4.2V and continue the charge and it was 1.7Ah also. So indeed it's 1.7Ah. Keep in mind, I have a 22Ah Lipo setup.

So:
1.7Ah/22Ah = 7.7% additional.
1.7Ah from 4.1 to 4.2 is real. But the 7.7% is only a guess unless you have done a complete discharge and verified that your pack actually has 22Ah.
 
I've done this test a few times with my 25s 12ah pack. I always get 10.5% of rated pack capacity (using watt-hours).
 
Around 5%.
That's why i always charge to 4.15-4.17v. Don't even need to hook up my batteries to the balancer. They never get disbalanced hot off the charge even at 4.17 nominal. Maybe one cell hits 4.19v for a few seconds during the end of charging, another is as low as 4.16 ... no big deal.
 
24_dischargingmechanics.gif


Old old graph of me discharging from 4.15v. Sorry that it doesn't show 4.2v, but you get the idea; from 4.2v to about 3.95v, the top part of the battery's discharge range is rather steep.

The bottom part after the cliff is steep too.

You will find that discharge graphs of many batteries does look like this.

tp-extreme-5000-discharge-curve-graph.gif


Here is a discharge graph from thunder power showing how their RC lipos perform.
 
58v would be the bulk charge number for 14s then. I set mine for 57.5 though, because much of my lipo is nearly 3 years old now.

It's a no brainer to charge to 4.2v anytime you really need that extra wh. But routinely charge to less when it doesn't matter.

The big dilemma for me is storage voltage. I just hate having my batteries need more charging for me to pop em on a bike and go. In summer, you like to ride just before sunup a lot in this climate. But I see now that it cost me to store them at full charge.
 
I was curious so ran a test this afternoon.

file.php

YOKU1cellcomps.jpeg

It was a 23 Ah cell run at room temperature. The test was done using a CBA III. Although I did not have a thermometer handy, no apparent temperature rise. I ran the 4.2 V test first, recharged to 4.18V and bleed down to 4.10V. Waited several hours. and ran the 4.1V discharge test. The 4.2 and 4.1V measurements were taken with a Fluke DMM, open circuit. The voltage shown on the CBA graph is about 0.05 to 0.15V lower than the Fluke readings depending on load, but consistent from test to test.

Charging to 4.2 Volts resulted in a 8.26% increase in capacity (Ah) compared to charging only to 4.1 Volts.
 
major said:
It was a 23 Ah cell run at room temperature. The test was done using a CBA III. Although I did not have a thermometer handy, no apparent temperature rise.
No apparent temperature rise? How did thing changed this drastically in such a short time?

major said:
So I repeated the 1C discharge test, 23 Amps constant. Starting temperature was 53°F. Yep, kind of chilly in the basement. The cell was the same one as before run on the same CBA III tester. I put the cell in a LipoSack for the duration and measured temperature with a handheld IR digital thermometer. I'd open the sack and read temps several times during the test but basically provided no ventilation to the cell. At the end of the test, temperatures varied on the cell surface from 75 to 82°F and a local hot spot of 85°F near the positive terminal. The black wire on the negative was at 92°F. I guess we could say a 30°F rise in an insulated bag.
 
SamTexas said:
major said:
It was a 23 Ah cell run at room temperature. The test was done using a CBA III. Although I did not have a thermometer handy, no apparent temperature rise.
No apparent temperature rise? How did thing changed this drastically in such a short time?

major said:
So I repeated the 1C discharge test, 23 Amps constant. Starting temperature was 53°F. Yep, kind of chilly in the basement. The cell was the same one as before run on the same CBA III tester. I put the cell in a LipoSack for the duration and measured temperature with a handheld IR digital thermometer. I'd open the sack and read temps several times during the test but basically provided no ventilation to the cell. At the end of the test, temperatures varied on the cell surface from 75 to 82°F and a local hot spot of 85°F near the positive terminal. The black wire on the negative was at 92°F. I guess we could say a 30°F rise in an insulated bag.

Thanks for keeping tabs. Maybe I need to get my palm recalibrated. I pressed my hand on the thing often during the test and didn't notice it getting any warmer. Wait, the previous test was in a LipoSack. This test had the cell simply laying on a Formica table top. Perhaps that accounts for the cell staying cooler.
 
SamTexas said:
A 30 degree rise in a bag would easily translate to 10, 15 degree in open air. Hard to miss.

Last time I was testing for temperature rise because you had inquired about it. This time I was looking at capacity between two cases and attempting to keep the two tests equal and fair. I did not have a thermometer. I simply went by touch and I guess I can't really notice a 10 degree F difference over 50 to 60 minutes. You can see the time stamps on the tests. Several hours would allow the cell to cool sufficiently to consider the test fairly valid. The other conditions were the same, so the cell heating would have been the same for both tests. I admit the controls were not really tight, but IMO pretty close. Results agree closely with what the OP found. I thought that a comparison curve would help explain what was going on.
 
Here is a plot from 4.2v to 4.15v on one of my Turnigy 6s 20c 10AH Sub Sections. Just take the values for AH and divide by 2 for capacity of 5AH packs.
 

Attachments

  • 4.2v to 4.15v.jpg
    4.2v to 4.15v.jpg
    187 KB · Views: 2,044
icecube57 said:
Here is a plot from 4.2v to 4.15v on one of my Turnigy 6s 20c 10AH Sub Sections. Just take the values for AH and divide by 2 for capacity of 5AH packs.

That's interesting, but like with the first graph neptronix posted, the IR drop gets mixed into it because you just show a single case. And as SamTexas pointed out, you don't show the actual capacity to calculate the percentage difference between the two cases (4.2 vs 4.1). That's what I was attempting to show with my test. The amount of charge between 4.2V and 4.1V is approximately the same as the charge between 4.1 and 4.0V, or between 3.9 and 3.8V. The discharge curve is fairly linear for a long stretch. The higher starting voltage simply displaces the curve to the right.
 
Here is the second graph of 4.2 to 4.1v
So its 3% for the 4.2 TO 4.15
And its 8% for the 4.2 to 4.1
 

Attachments

  • 4.2v to 4.10v.jpg
    4.2v to 4.10v.jpg
    192.4 KB · Views: 2,036
It seems like majors results and mine are pretty close. I could possibly dial mines in a bit more but i dont have the time to do a full discharge on a pack that is known to give me 10.2-10.3AH
 
major said:
The amount of charge between 4.2V and 4.1V is approximately the same as the charge between 4.1 and 4.0V, or between 3.9 and 3.8V. The discharge curve is fairly linear for a long stretch. The higher starting voltage simply displaces the curve to the right.

This i dont quite agree with cause mt 4.2 to 4.15 netted me 331mah... on the 4.2 to 4.1 gave me 805mah. So the capacity thats between 4.15 and 4.1 is 474mah but this is on my 10AH pack so put this in a 5AH pack perspective....

165mah on a 5AH pack 4.2 to 4.15
402mah on a 5AH pack 4.2 to 4.15

There is a 237mah difference between the two ranges.

Im going to plot my entire pack and also post the excel graph so you can see at what voltage of the discharge has X amount of MAH and we can nip this in the bud and it can be put into the wiki afterwards.
 
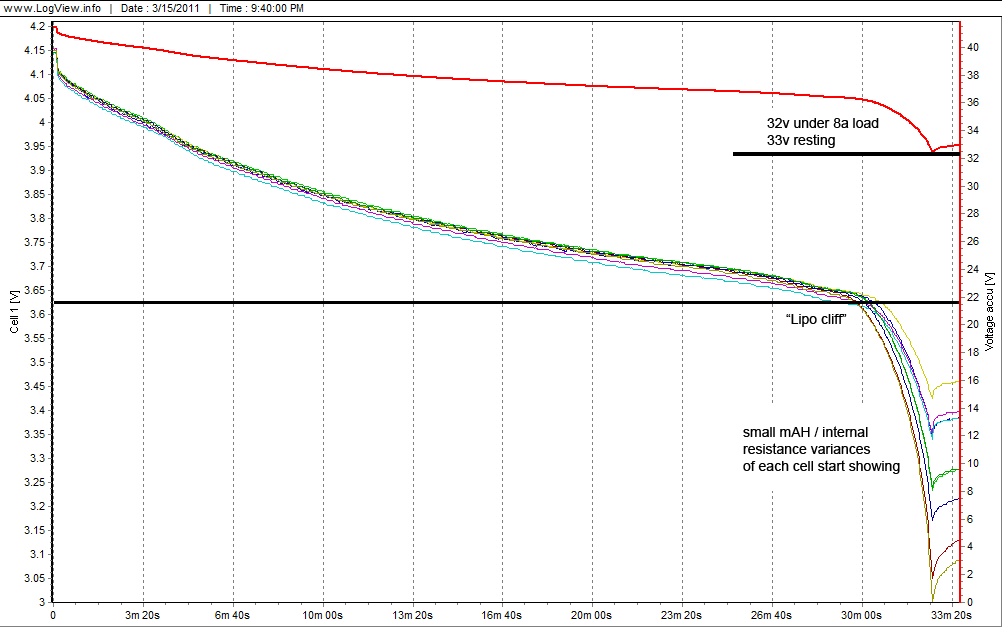
I have a discharge plot of one of my 10AH sections from 4.2v to 3.0v and there is an excel sheet that recorded all the data so you can pull the data and come up with you own conclusions. There are 6 cells so there are 6 sets of data. Again to scale it down to a 5AH pack divide by 2.
 

Attachments

  • 10AH Full Discharge.jpg
    10AH Full Discharge.jpg
    165.7 KB · Views: 2,007
  • 10AH Full Discharge.xls
    1.3 MB · Views: 29
icecube57 said:
major said:
The amount of charge between 4.2V and 4.1V is approximately the same as the charge between 4.1 and 4.0V, or between 3.9 and 3.8V. The discharge curve is fairly linear for a long stretch. The higher starting voltage simply displaces the curve to the right.

This i dont quite agree with cause mt 4.2 to 4.15 netted me 331mah... on the 4.2 to 4.1 gave me 805mah. So the capacity thats between 4.15 and 4.1 is 474mah but this is on my 10AH pack so put this in a 5AH pack perspective....

165mah on a 5AH pack 4.2 to 4.15
402mah on a 5AH pack 4.2 to 4.15

There is a 237mah difference between the two ranges.

I think you meant:

165mah on a 5AH pack 4.2 to 4.15
237mah on a 5AH pack 4.15 to 4.1

But what I am saying is that the first range (4.2 to 4.15) includes the drop in voltage caused by the application of the load (the voltage caused by the current times the internal resistance of the cell). This I*R drop does not represent any depletion of charge. Therefore it needs to be normalized for a comparison of charge versus voltage range. That is what I was attempting to show with my test.

Obviously the cell I tested is quite different in characteristics than the hobby Lipos you use. I am not sure what fits the actual definition of Lipo or what convention is used on this board as I am a newcomer here. I thought the YOKU cell I tested would fit the classification of Lipo. It is similar to other cells which I have tested from EnerDel and Kokam in the shape of the curve. There is a difference in internal resistance and slope between these cell types. There is also a difference in the voltage level at the low SOC knee. But at the high end of the SOC (at 4.2 Volts open circuit), all the types I have tested appear to be linear in voltage vs charge. From experiments I have done, this holds true even when you go higher in voltage like up to 4.3 or 4.4V, although I don't recommend that.

This is important because the charge at the higher voltage represents greater energy. You can get more energy from the battery by using a SOC range (percentage) at the high voltage end of the curve than the same SOC range at the middle or low voltage end. If you simply take your numbers at face value, then you may not see that charging to 4.2V is as beneficial (or more so) than charging to 4.1 or 4.15V with regards to energy storage which relates to range for the vehicle.
 
Back
Top