sendler2112 said:
Run the numbers. There is no way to possibly build out enough wind and solar hardware to even come close to replacing what we are using. Not to mention the storage issue that no renewable (rebuildable) advocate ever wants to talk about. The editorial style of the writers gets a little cutesy and long winded but the "Roadmap To Nowhere" lays out some good analysis to show the futility of believing a wind/ solar energy system can ever replace what we have now.
.
http://www.roadmaptonowhere.com/wp-content/uploads/2018/01/RTN-Jan-11-2018.compressed.pdf
https://scontent-lga3-1.xx.fbcdn.net/v/t1.0-9/31206195_1660836967328742_2701786389145452544_o.jpg?_nc_cat=0&oh=1511a40cd8e029ab6c8db13b74611ddd&oe=5B561D0E
.
.
Joe discusses polarizing group bias
.
https://www.youtube.com/watch?time_continue=13&v=sZB1YtQtHjE
I don't think it's worthwhile doing more than 1 post trying to convince people if or how much co2 can affect the earth climate, there's practically zero chance folks are going to change their mind on that stuff, but we can drill down into more simple hard facts and numbers on energy generation.
I have to say that first youtube is full of baloney, https://youtu.be/sZB1YtQtHjE?t=7m55s
Even at minute 7:55 he claims co2 causes the plant to require more water for the same plant growth, this goes against basic photosynthesis science.
This is basic photosynthesis science because we all should know that plants have to open up their pores on their leaves to absorb co2, but opening up their pores also means water loss if there are no co2 particles to absorb every second they are open, so more co2 means faster absorption of the co2 thus requiring less open pores that cause water loss in the process.
All up I think that guy rants on crap in that video that is just fundamentally wrong, I think hes just making up crap for more views.
https://www.seeker.com/earth/climate/plants-are-absorbing-more-co2-from-the-atmosphere-without-using-more-water
more efficient at using carbon dioxide to thrive while requiring less water by tightening tiny pores called stomata that permit gas to enter without letting water out
BTW, I read fair amount of that book btw.
That's a great book that one, and I like how its been analyzed by a ton of scientists/engineers.
Even though I can use the most basic math to show how bad capacity factors are in wind/solar and use numbers from official government generation sources most pro-renewable folks just ignore it and tend to just spam 'CF facts' from garbage renewable-energy news sites.
http://www.roadmaptonowhere.com/wp-content/uploads/2018/01/RTN-Jan-11-2018.compressed.pdf
One theory I have is that
already with the next Tesla roadster having a 200KWh battery and the Tesla truck rumored to have a multi-MWh battery I can't help but imagine that large cars will sit as high as 400KWh, like the American King Cab family vehicle or cars of that nature.
And if they have two of those large EVs in a family and do a lot of driving then its 800KWh that could be consumed in a day in an extreme event like using both cars and driving home from a road-trip holiday or any long-distance travel.
Then the oldest kid is growing up in the family and he gets his first car at 200KWh car as well. Plenty of families do have 3 cars these days in the latter years of the family when the kids have grown up.
Being the future everything will be low carbon electric based so no gas oven to cook with.. There are lots of double compartment electric ovens now at the 10KW mark, so if its a large family and they cook for 2 hours thats 20KWh gone, the electrically heated house and pool etc. A solar roof + power-wall will only be good at running the home appliances and not vehicles etc. Can a home solar roof pull in 30KWh every day of the year?
All up it won't surprise me that in more situations we could have the 1MWh house-hold per day for our happy low carbon future the way these EVs etc are going.
I liked this bit out of the book because this is what I been imaging too, the true overhead of it having a pure all renewable USA means constant replacing of renewable generation equipment on a scale that is hard to imagine.
It also means that 5 years after completion, we'll have to start recycling and replacing the solar panels – all 18 billion square meters' worth.
That's billion with a B.
A 40-year solar refurbishment schedule would mean the recycling and replacement of 1.23 million square meters of worn-out panels, every single day, rain or shine – forever
Then I think in about 25 years time we will have a fair amount of electric flying cars. https://www.youtube.com/watch?v=ohig71bwRUE
[youtube]ohig71bwRUE[/youtube]
Because flying takes A LOT of energy (god help us if we need to fight over that), so I imagine the future house-hold with flying cars being something around the order of
"the 10MWh per day family".
And that's when I get a bit sad, because it looks like the world is following that PDF renewable energy dream/nightmare, a quite fair cost estimation of $16.5 trillion dollars means very high electricity bills to make it happen or at least get close.
The reason its sad is because its obvious that electricity will cost so much that all of this stuff in our low-carbon future will only be available for the rich. All the rich people will by flying over in flying electric cars and below the poor will just watch on. The irony will be that the poor probably voted for the renewable energy future that gives more to the rich and causes them to miss out of being able to have flying electric cars etc.
I been looking at electricitymap lately and I have realized that they lie by around 10% on a lot of the "Installed Capacity" of Wind-farms or Solar-farms, by under-claiming their size, this makes the generation totals look better than they really are.
I am not surprised about this, it seems to be no matter what area you look at in renewables, someones always lying about the data/performance etc.
So far I have looked at Denmark, South Australia and Germany, all of them have under-claimed installed capacity by about 10%.
Lets look at Denmark first. If you bring up EM and check both sides of the country as their electricity is split between two states East and West you see the total 'Installed Capacity' of wind is 3.81GW + 1.04GW = 4.85GW
But all the articles on the internet claim Denmarks wind capacity is
5475MW
https://ens.dk/en http://www.windpower.org/en/knowledge/statistics/the_danish_market.html
There are all the typical renewable energy news sites are claiming Denmarks Capacity Factor for wind is over 40% but its pretty easy to look at the official numbers and see its only 30% which for the country in the ultimate wind zone is pretty crappy.
Denmark installed wind capacity 5.475GW (5,475MW)
Generated 2017: 14,700 GWh
There are 1,000MWh in 1GWh.
14,700GWh = (14,700,000MWh / 8765.5hours_in_a_year) = 1,677MW average power generation (1.677GW)
So ( 1,677MW / 5,475MW ) x 100 = 30% capacity factor Wind
Those websites claiming 44% for Denmark are complete utter baloney, theres nothing in the numbers for that at all.
https://cleantechnica.com/2018/01/06/44-wind-denmark-smashed-already-huge-wind-energy-records-2017/
.png")
Also note that it seems to be that Denmarks setup of utilizing their wind-turbines is along the lines of "just for fun", because they just constantly burn coal and when the wind does come through they just export it to other countries. But thats not really lowing co2 that way, its just lazy cheating.
South Australia is the same, they have the official AEMO pdfs say 1,810MW installed wind capacity
http://anero.id/energy/wind-energy
but on Electricitymap.org its 1,560MW
.png")
Germany the same, there installed Wind Capacity is 55,900MW while electricity map claims only 49,600MW
This PDF below is great, its all official 2017 numbers for Germany on just about everything to do with electricity in Germany.
https://www.erneuerbare-energien.de/EE/Redaktion/DE/Downloads/development-of-renewable-energy-sources-in-germany-2017.pdf?__blob=publicationFile&v=17
What first made me suspicious was the fact that everytime I look at Germany its such a wind-less country compared to the high wind-zone that England and Denmark enjoy having their land so deep out in the sea where the wind builds up speed.
Anywhere there is a lot of land the wind just dies away typically. Even Italy doesn't get much wind because its surround sea area isn't big enough compared to the huge bodies of land around it.
Here is a typical sight when looking at the wind on electricitymap. Red arrows, lots of wind, blue very little wind.
This is why I started to see Wind much like Solar or Hydro electricity, you can't actually build anywhere, the capacity factor will vary a lot.
.jpg")
Before I did the calculations and claimed Germany has wind capacity factor of 23%, even though I felt that was dubiously high.
I googled around wondering what news sites etc claim and
Wikipedia's page on Germany wind is far more honest https://en.wikipedia.org/wiki/Wind_power_in_Germany#Statistics and they put the Capacity Factor at
21.30% for 2017.
It was 17.95% for 2016!
Germany installed wind capacity for 2016: 49,534MW (Which is what EM claim it is for 2018, so to me they are deliberately 1 year behind to make the capacity factor look better then it really is on live generation stats)
Germany 2016 generation 77,412GWh
(77,412,000MWh / 8765.5hours_in_a_year) = 8831MW average power generation (8.831GW)
So ( 8,831MW / 49,534MW ) x 100 =
17.8% Capacity Factor Wind
I feel a lot better now, those old numbers on CF were really bugging me as they just didn't feel right.
*Addon*
https://en.wikipedia.org/wiki/Wind_power_in_Germany#Statistics
Total installed capacity and generation in Germany (land and sea based combined)

So looking at the last 8 years of Wikipedias page on Germanys Wind Capacity factor we can do the math on
average capacity factor number over the years.
(16.04%+ 19.44%+ 18.68%+ 17.75%+ 17.07%+ 20.43%+ 17.95%+ 21.30%) / 8 = 18.58%
So Germanys long term average wind capacity factor is
18.58%
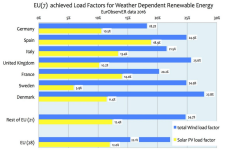
I just came arcoss this capacity factor for Wind and Solar for Europe which really seems quite accurate.