Samsung INR18650-25R cycle test.

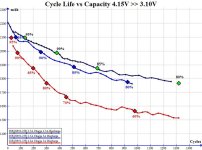
29E requested cycle test parameters?

Discharge graph shows optimal static voltages between ~4.10V >> 3.20V

Spec sheets list various charge\discharge rates
This Samsung pdf
lists as 1375mAh (.5C) charge\2750mAh (1C) discharge
Max 2750mAh (1C) charge\2750mAh (1C) discharge 8750mAh (3C) surge
 

Attachments

  • INR18650-29E-3.pdf
    252.2 KB · Views: 418
Samsung INR18650-25R cycle test results


file.php


Note! - previous chart accidentally posted cycle #40 at position count 0.
Corrected chart shifts graph lines into much more reasonable positions!

file.php


New line positions make equal starting capacities within the realm of reasonable probability.
So, for direct comparison, I graphed capacity percentages at at the same mAh.

file.php


Most reasonable explanation for the occasional increases of capacity is environmental >>> temperature! ... ?
This is supported by 2.5A and 5.0A test fluctuating at, seemingly, the same time.

Charge\Discharge Range vs Capacity - Results
 
Charge\Discharge Range vs Capacity - Results

DrkAngel said:
electricbike said:
Last test nr 5 is done.

Test1: 4.20V >>> 2.50V @ 2.5A (Similar to OEM test voltage) Done.
Test2: 4.20V >>> 3.10V @ 2.5A (electricbike test voltage +OEM high) Done.
Test3: 4.15V >>> 3.10V @ 2.5A (electricbike test voltage, as control) Done.
Test4: 4.10V >>> 3.10V @ 2.5A (new recommended Test4:) Done.
Test5: 4.10V >>> 3.20V @ 2.5A (DrkAngel derived optimal @ 1C C\D rate) discharged voltage altered to 3.20V Done.
Series complete ...

file.php
 
Single cycletest is uppdated with 1250 cycles and it has reach 80% of start capacity and therfore this test is ended.

Difference test is uppdated with 960-1320 cycles and will be paused because i am going for 1 week holiday soon, the difference test will continue after that.
 
Graphs are provided to allow everyone to determine their own voltage ranges and charge\discharge rates.

  • Obvious conclusions are:
  • Discharging below 3.20V voltage, at 1C, returns minimal extra capacity.
  • Graph displays capacity loss for each reduction in charged voltage.
    (Lower charged voltage increases cycle life - you judge graphed capacity loss vs increased cycle life!)
  • Maximum charge rate greatly reduces cycle life
  • ≤1C charge rate increases cycle life extremely!
  • ≤1C discharge rate increases cycle life notably!
 
Updated from latest data:

file.php
 

Attachments

  • 40-40.jpg
    40-40.jpg
    79.6 KB · Views: 1,330
999zip999 said:
I cannot understand the difference between your test you're all showing the flat line on all 6 test. ?
Height of line is mAh capacity - graduations on left
Length of line (left >> right is discharge\charge voltage) - graduations on bottom
 
Looking on the "difference test" , I would say, that charging with >1C does not decrease cycle life. After significant initial loss (first 480 cycles) the characteristics is flatter for 4,0A charge than for 2,5A. The graphs would eventually cross at 1500 cycles.

Electricbike, can you for comparison do a single, or 2-3 cycles 1C charge / 5A discharge on the cell that was up to now charged with 4,0A?

I think, that the cut off current for 4,0A charge is responsible for lower capacity.
 
Skrzypas said:
Looking on the "difference test" , I would say, that charging with >1C does not decrease cycle life. After significant initial loss (first 480 cycles) the characteristics is flatter for 4,0A charge than for 2,5A. The graphs would eventually cross at 1500 cycles.

Electricbike, can you for comparison do a single, or 2-3 cycles 1C charge / 5A discharge on the cell that was up to now charged with 4,0A?

I think, that the cut off current for 4,0A charge is responsible for lower capacity.

Yes, will do so when i am back from my 1 week holiday.
 
DrkAngel said:
Graphs are provided to allow everyone to determine their own voltage ranges and charge\discharge rates.

  • Obvious conclusions are:
  • ≤1C discharge rate increases cycle life notably!

How do you come to this conclusion? 2.5 amps discharge vs 5 amp discharge has no noticeable difference in cycle life. Which makes sense because this 25R cell can go to really high discharge rates, much greater than 5 amps.
 
2.5A discharge cycle life hits 80% capacity @ 1315 cycles. = 140% cycle life of 5.0A
5.0A discharge cycle life hits 80% capacity @ 920 cycles. = 70% cycle life of 2.5A
 
DrkAngel said:
2.5A discharge cycle life hits 80% capacity @ 1315 cycles. = 140% cycle life of 5.0A
5.0A discharge cycle life hits 80% capacity @ 920 cycles. = 70% cycle life of 2.5A


Wait a second here. You see this is why I recommend doing the 4.2 to 2.5 volt test every 50th cycle because of this confusion.

I believe you are not taking in the original capacity of the battery at the start because of the different discharge rates.

Original 2.5A 1st cycle had 2208 capacity
Original 5A 1st cycle had 2143 capacity.

This is a difference of 65 MAH because of the higher voltage sag at 5A.

2.5A had ~1820 capcity at ~960 cycles
5A had 1762 capacity at 960 cycles


1820 - 1762 = 58 capcity , but this doesn't take into account the higher voltage sag at 5A.

The very first cycle had a 65 MAH lower difference because of the higher voltage sag or discharge current of 5 Amps and therefore more voltage sag stopping the cycle earlier which I believe you are not taking into account.

So technically speaking, the 5A actually had better cycle life when taking this into consideration.

Please tell me I am wrong here, because if you are not taking this into account then this is more reason to do the tests my way with the 4.2 to 2.5 volt capacity test every 50th cycle.
 
Check chart again.
A mistake lost 1st 40 cycle info.
1st listed for "difference" is at 40 cycles, with the typical preliminary drastic drop in capacity.

MAh capacity due to 2.5A discharge vs 5.0A discharge looks to be between 20 and 30mAh ... ~1% capacity! (by mAh)

Samsung INR18650-25R 2500mAh 5A vs 2.5A.jpg


Samsung INR18650-25R 2500mAh 5A vs 2.5A Zoom.jpg
 
Overclocker said:
hi! i plan to do similar testing w/ my 250W reaktors...

how many cycles can you do in 24 hours?

It depends on the tested charge and discharge rate. For example 1C-1C test at 100% DoD for the most of cells gives you: 1h 45min for charging, 10min rest time, 1h for discharging and 10min rest time = ~3h per cycle = 8 cycles per day.
 
DrkAngel said:
Graphs are provided to allow everyone to determine their own voltage ranges and charge\discharge rates.

  • Obvious conclusions are:
  • Discharging below 3.20V voltage, at 1C, returns minimal extra capacity.


  • There will be a huge capacity decrease if discharging at higher C rates with a 3.2v cutoff. For example 10-20A. But at 1C there is very little voltage sag on a cell like this.
 
Added percentage lines to low rate discharge map.

file.php


Being derived from discharge data, though minimal, accurate data would be represented by shifting graph lines slightly higher.

Shift graph line (Pink) to the right slightly or
Shift percentage lines slightly left ... possibly .02V?

Optimal charged voltage appears to be near 4.12V.
 
I'm not sure if i already have mentioned here that it would be great if future controllers come with a variable cut off function which include, aside from voltage alone, also the amperage.

for instance:

at battery current of 10A per cell, voltage is allowed to drop to 2,5V per cell
if voltage sags to the limit, controller reduces current AND increase minimum voltage per cell at the same time
to something like at 3,2V no more than 1A per cell are allowed and at 3,3V 0A are allowed.

this would mean we could use maximum Power until battery reaches desired s.o.c (or IDLE voltage) without shortening lifetime.

please tell me what you think about that?
could this work in practice?
 
Back
Top