Tabless design cylindrical cells tests

I think those unpleasant words were directed at FEB, not Vapcell. I have heard similar things about FEB production from two sellers. But unlike Vapcell's production, I haven't had a chance to test FEB yet.
Ahh…okay, thanks. He mentioned he thought they were the same cell so I assumed that he was saying Vapcell rewrapped it and any of his comments would be apply to both. Now that you mentioned it though, I have a memory of someone talking earlier about FEB cell quality.
 
Hmm…would be interesting indeed. I can get them to about -11°C to -16°C in my freezer.
Prettty swamped with patron requests but will see if I can, might take a while. I’m thinking 30PL, P30B, and JP30 instead though, since I have all three here.

I can replicate Ampace’s stated test conditions, and hope we can compare results from the P50B and 40PL fairly, but it would be a lot better IMO if all cells were tested here under the same conditions.
Really cool, thanks.

I wish I could test this, but I'll only get EVE 50PLs soon and the only other high power cells I still have are Samsung 30Ts; I sold my 40PLs and 40Ps a while back.
 
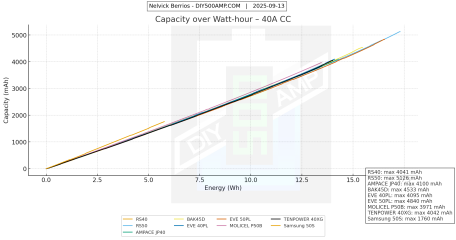
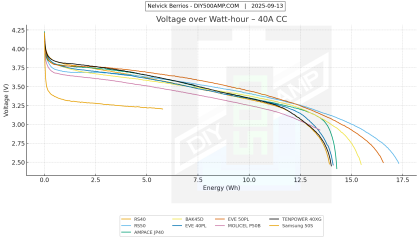
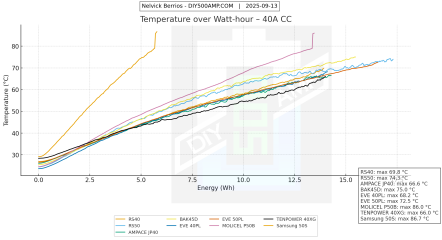
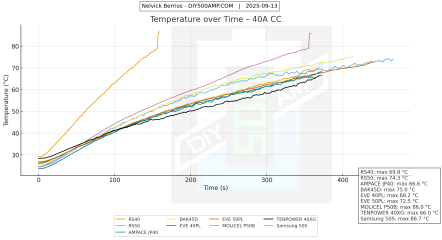
Ok this time corrected with the 40A annotation.
 

Attachments

  • Capacity over Watt-hour – 40A CC.png
    Capacity over Watt-hour – 40A CC.png
    308.4 KB · Views: 80
  • Voltage over Watt-hour – 40A CC.png
    Voltage over Watt-hour – 40A CC.png
    319.1 KB · Views: 62
  • Voltage over Time – 40A CC.png
    Voltage over Time – 40A CC.png
    304.3 KB · Views: 62
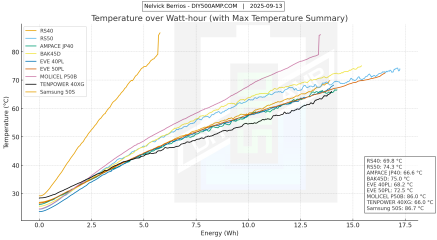
  • Temperature over Watt-hour – 40A CC.png
    Temperature over Watt-hour – 40A CC.png
    380.2 KB · Views: 60
  • Temperature over Time – 40A CC.png
    Temperature over Time – 40A CC.png
    369.4 KB · Views: 60
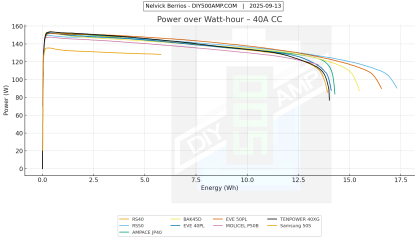
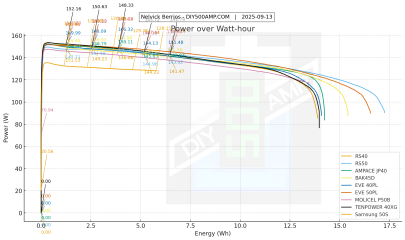
  • Power over Watt-hour – 40A CC.png
    Power over Watt-hour – 40A CC.png
    273.2 KB · Views: 61
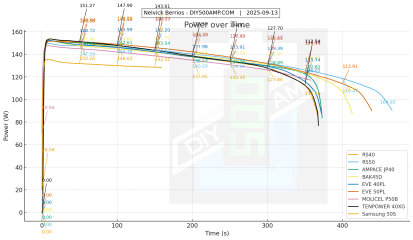
  • Power over Time – 40A CC.png
    Power over Time – 40A CC.png
    329.3 KB · Views: 60
  • Current over Watt-hour – 40A CC.png
    Current over Watt-hour – 40A CC.png
    192.7 KB · Views: 67
  • Capacity over Watt-hour.png
    Capacity over Watt-hour.png
    328.6 KB · Views: 52
  • Power over Time 3.png
    Power over Time 3.png
    457 KB · Views: 58
  • Temperature over Watt-hour.png
    Temperature over Watt-hour.png
    409.3 KB · Views: 55
  • Temperature over Time.png
    Temperature over Time.png
    485.1 KB · Views: 51
  • Power over Watt-hour.png
    Power over Watt-hour.png
    430.9 KB · Views: 54
  • Power over Time.png
    Power over Time.png
    522.1 KB · Views: 58
  • Voltage over Time.png
    Voltage over Time.png
    482.7 KB · Views: 59
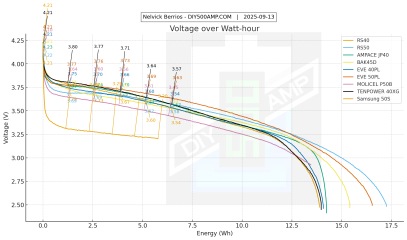
  • Voltage over Watt-hour.png
    Voltage over Watt-hour.png
    463.3 KB · Views: 76
Someone has to say it: the Molicel P50B is definitely out of the game, and if Molicel want to maintain their status as a technology leader, they need to release both the P60B and M65A as soon as possible.

Btw. Great work! @ZEUS-FL
What will be interesting is the release of the M65A, P60B, P60C, XA3, 22S, 30S, and 50S all within a fairly narrow time window. I’m guessing a couple of years before the P70, P85, and the other XA Series cells though.
 
Just curious…what are you referring to when you say the F60 is “garbage”, “not very stable”, and “can barely handle 13A”?

The FEB 6000mAh 21700 does indeed have a 4.20V to 2.75V range for its cycle life spec but FEB’s discharge graphs for it go down to 2.5V. I couldn’t find a full datasheet. The F60 is rated down to 2.5V too but that’s Vapcell’s rating.
I have the FEB 6000mAh datasheet. If you need it, you can message me privately.
 
IMO, the best thing that will come out of tabless cells will be anode-free cylindrical cells.

One of the particular downsides with tabbed wound cells is that interconnect<>electrode heterogeneity tends to introduce very annoying behaviors when it comes to degradation modes.

However, since tabless electrodes are almost perfectly homogenous, you can be quite a bit more aggressive when it comes to anode-free designs, getting quite closed to stacked foil pouch cell designs in terms of flexibility.
 
Reliance 50RS
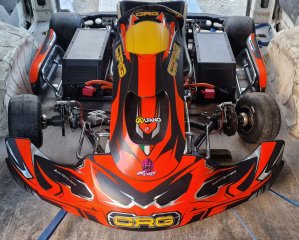
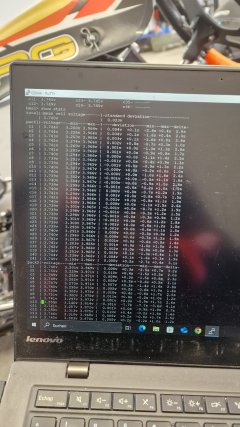
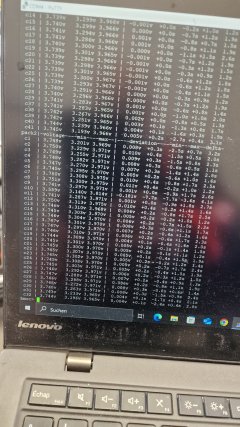
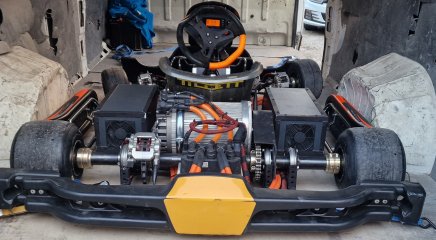
Finally, the time had come and I was able to test the 16P32S Reliance 50RS battery packs 😃 I charged the cells to an average of 4.06 V. After the first test drive on the race track (25 km) with 750 A discharge and 240 A recuperation, I noticed that the cell voltage had dropped to 3.2 V. What I noticed while observing the cells was interesting: The voltage in the 1st to 6th parallel groups increased, the voltage in the 7th to 25th parallel groups remained the same, and the voltage in the 26th to 32nd groups decreased. The whole thing looks like a pyramid. Does anyone have an explanation for this?

I can, however, praise the cells, as they never exceeded 40 degrees Celsius (air-cooled, of course) and were still able to deliver 750 A with 16P on the second test drive despite the cell voltage dropping to 2.8 V.

If anyone is interested, I can upload a short video of the race track during the second test drive.
 

Attachments

  • 20251002_180053.jpg
    20251002_180053.jpg
    1.1 MB · Views: 49
  • 20251003_120316.jpg
    20251003_120316.jpg
    1.7 MB · Views: 45
  • 20251003_120307.jpg
    20251003_120307.jpg
    1.7 MB · Views: 39
  • 20251003_085822.jpg
    20251003_085822.jpg
    1.7 MB · Views: 29
  • 20251003_085810.jpg
    20251003_085810.jpg
    1.9 MB · Views: 36
  • 20251002_180043.jpg
    20251002_180043.jpg
    1.1 MB · Views: 43
The cells can only do so much the rest comes down to how the pack is built and balanced. Things like wiring layout, busbar design, and how the groups are connected make a big difference. Without seeing your setup, it’s tough to say what’s going on. I’d probably move this post to the pack design or troubleshooting section so you can get better feedback. Not trying to be rude, just honestly trying to help.
 
Reliance 50RS
Finally, the time had come and I was able to test the 16P32S Reliance 50RS battery packs 😃 I charged the cells to an average of 4.06 V. After the first test drive on the race track (25 km) with 750 A discharge and 240 A recuperation, I noticed that the cell voltage had dropped to 3.2 V. What I noticed while observing the cells was interesting: The voltage in the 1st to 6th parallel groups increased, the voltage in the 7th to 25th parallel groups remained the same, and the voltage in the 26th to 32nd groups decreased. The whole thing looks like a pyramid. Does anyone have an explanation for this?

I can, however, praise the cells, as they never exceeded 40 degrees Celsius (air-cooled, of course) and were still able to deliver 750 A with 16P on the second test drive despite the cell voltage dropping to 2.8 V.

If anyone is interested, I can upload a short video of the race track during the second test drive.

This is probably due to temperature deltas and other interconnect bottlenecks.

The cells in front of the cooling setup will be coolest vs the other cells, which means they have higher IR, and you know the effect of that.
 
The cells can only do so much the rest comes down to how the pack is built and balanced. Things like wiring layout, busbar design, and how the groups are connected make a big difference. Without seeing your setup, it’s tough to say what’s going on. I’d probably move this post to the pack design or troubleshooting section so you can get better feedback. Not trying to be rude, just honestly trying to help.
The battery pack's busbars and busbars are identical between the groups. They are comparable to 40 mm² copper cables. The battery pack is connected to the control box via a 50 mm² cable. It could be that due to the different cable dimensions, the first and last parallel groups can produce more power than the others, or, as BlueSwordM suspects (the cells before the cooling structure are the coolest compared to the other cells), the first 1-6 and the last 32-26 groups are better ventilated. Thanks for your help.
 
This is probably due to temperature deltas and other interconnect bottlenecks.

The cells in front of the cooling setup will be coolest vs the other cells, which means they have higher IR, and you know the effect of that.
I agree with your theory, as the coldest cells are from 1 to 6 and from 32 to 26. I'll reconfigure the temperature sensors during the next test to complete the process, so I can measure groups 1-32, 3-29, 6-26, 11-21, and 16-17 and determine the temperature difference. Thank you very much for your tips.
 
I agree with your theory, as the coldest cells are from 1 to 6 and from 32 to 26. I'll reconfigure the temperature sensors during the next test to complete the process, so I can measure groups 1-32, 3-29, 6-26, 11-21, and 16-17 and determine the temperature difference. Thank you very much for your tips.
*Hypothesis.
A theory is something proven, and we haven't proven anything yet :)

I wonder if you can decrease the temperature deltas by employing preheating to around 30C before the race.

That's what Hyundai does on the Ioniq 5N on long races.
 
Reliance 50RS
I charged the cells to an average of 4.06 V.
...
If anyone is interested, I can upload a short video of the race track during the second test drive.
At what voltage does your BMS start balancing the cells?

Average of 4.06v can mean a wide disparity.

I'd want all parallel groups as near exactly the same voltage as possible before being worried that some P groups seemed to be sagging more than others.

32 balance cables also leaves a lot of room for Human error factor.

Would love to see video of a 32S 16P pack of RS50's delivering 750 amps to a track beast !
 
*Hypothese.
Eine Theorie ist etwas Bewiesenes, und wir haben noch nichts bewiesen:)

Ich frage mich, ob Sie die Temperaturdifferenzen verringern können, indem Sie vor dem Rennen auf etwa 30 °C vorheizen.

Das macht Hyundai mit dem Ioniq 5N auf langen Rennen.
😊
 
At what voltage does your BMS start balancing the cells?

Average of 4.06v can mean a wide disparity.

I'd want all parallel groups as near exactly the same voltage as possible before being worried that some P groups seemed to be sagging more than others.

32 balance cables also leaves a lot of room for Human error factor.

Would love to see video of a 32S 16P pack of RS50's delivering 750 amps to a track beast !
Balancing starts at 3 V and draws only 170 mA. I'm considering installing a 4 A active balancer as well. At the beginning of the video, I had 110 V in the battery pack. During the last lap, the cell voltage briefly dropped below 2.8 V (1-6, 26-32 parallel groups), which triggered a low-voltage alarm. After the last lap, the battery indicator shows 101 V. Unfortunately, I didn't take any photos of the cell values after the last lap.

Unfortunately, the video is too large and can't be uploaded, so I have to shorten it. I will upload the videos to my YouTube channel in the next few days so you can also see longer videos.🙂
 
At what voltage does your BMS start balancing the cells?

Average of 4.06v can mean a wide disparity.

I'd want all parallel groups as near exactly the same voltage as possible before being worried that some P groups seemed to be sagging more than others.

32 balance cables also leaves a lot of room for Human error factor.

Would love to see video of a 32S 16P pack of RS50's delivering 750 amps to a track beast !
Unfortunately, I've just realized that I'm not allowed to upload a video file directly here. However, I have videos on my YouTube channel not of the new chassis and battery pack, but of the old chassis and with the old battery pack.😔
 
Back
Top