Discharge Curve: Headway 38120S (screw terminal) 10ah cell

AndyH,

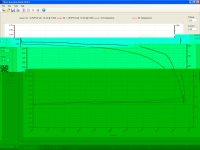
The current calibration i got was centered to 10A.. I used 3 differents tool to measure it externally to compare. The first was a reference shunt of 50mV at 20A that gaved me 25.1mW ai it's 10.04A.

the second is my Meterman Multimeter (made by Fluke and already compared with it and got perfect accuracy) and i got 10.1A and the last method i verified is a shunt made by Caddock MP916 0.01ohm and i measured 102mV

So i can say with confidence that the value around 10A are acurate as long as i dont touch the internal shunt of the CBA.

at 1.0A the value is 1.0A , with the help of the corection by the version 2.

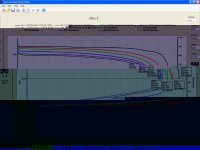
Your results with the LaMantia BA402 seems on the same target with around 5h for 10Ah. What i love is the % of capacity fonction for comparaison.. that is nice!

Doc
 
Exactly why it's most meaningfull to have all these cells tested on the same setup, consistent results, consistent error readings, but all tests done by the same system... this is getting fun !!

( This is gonna royally suck, but i'm opening up the 5 cell pack on my chopper to send a 12ah prismatic cell as well !! :D )
 
Ypedal said:
Exactly why it's most meaningfull to have all these cells tested on the same setup, consistent results, consistent error readings, but all tests done by the same system... this is getting fun !!

( This is gonna royally suck, but i'm opening up the 5 cell pack on my chopper to send a 12ah prismatic cell as well !! :D )


:wink:
 
Cell no 2 first test result (0.1C and 0.5C)

Please note that this cell have the exact same tests condition than the first cell except that i did not cycled it 10 times like for the first cell.. I did zero previous cycle on it..

the 0.1C gave 10.73Ah and the cell no 1 that had many cycle at high current had 10.62Ah
the 0.5C gave 10.61Ah and the cell no 1 that had many cycle at high current had 10.44Ah

Doc
 

Attachments

  • 1 et 5A_1024x768.JPG
    1 et 5A_1024x768.JPG
    74 KB · Views: 1,956
Doctorbass said:
So i can say with confidence that the value around 10A are acurate as long as i dont touch the internal shunt of the CBA.

Thanks Doc - sounds great to me! I have resisted modifying the CBA specifically because I didn't want to create another 'one-off' test device -- I wanted numbers that anyone else with a CBA could duplicate and use for comparison. But when the bloody current numbers don't match the Fluke or the LaMantia (or even the old almost-dead Radio Shack meter... - :evil:

For the CBA Software and multiple tests - have you tried to save results singly, then use the 'file/overlay' function to add earlier tests to the display? The new software seems to work as well as the old for this overlay capability - at least on the Windows XP box that I'm running it on.

Andy
 
AndyH said:
Doctorbass said:
So i can say with confidence that the value around 10A are acurate as long as i dont touch the internal shunt of the CBA.

Thanks Doc - sounds great to me! I have resisted modifying the CBA specifically because I didn't want to create another 'one-off' test device -- I wanted numbers that anyone else with a CBA could duplicate and use for comparison. But when the bloody current numbers don't match the Fluke or the LaMantia (or even the old almost-dead Radio Shack meter... - :evil:

For the CBA Software and multiple tests - have you tried to save results singly, then use the 'file/overlay' function to add earlier tests to the display? The new software seems to work as well as the old for this overlay capability - at least on the Windows XP box that I'm running it on.

Andy

Mine still dont work with the overlay and still unable to open a previously saved file... so i need to keep my conputer an dthe CBA ON as long as the test is not completly finished with all dishcharge graph...

it's winter here.. so these kWh draw by my computer are recovered in usable heat... at least...

Doc
 
Doctorbass said:
it's winter here.. so these kWh draw by my computer are recovered in usable heat... at least...
Doc

That I understand! I'm originally from the south shore of Lake Superior. The 8 months of winter is more comfortable if you spend the summer in da bush making wood to fill the basement. :D

Here's a look at IR over a discharge. This is only the 2nd cycle - this cell is not yet broken in.

headway_IR2.JPG

DC IR tested automatically at .5A and 2A load. Cell charged to 2.70V with VoltPhreak charger. Cell rested about four hours before test.
[edit] added annotated chart [/edit]
 
CELL no 2 test completed

Thisone seems a better than the first and the 3C voltage and curve seems same as the Yesa 10Ah cell at 3C

I represented the graph in 3 different scale for Wh, Ah or starting to 0V on Yaxis instead of 1.5V to see the complet dynamic voltage.


Doc
 

Attachments

  • 1 5 10 20 30 et 35A Wh all_1024x768.JPG
    1 5 10 20 30 et 35A Wh all_1024x768.JPG
    64.6 KB · Views: 1,924
Cells 1 and 2 compare on same graph

Please note that the cell 1 had already 10 cycles at high rate discharge. It is a possibility that this cell no 2 could be better than the first... or maybe it's because of the 10 firsts cycles that it sufered a bit... (10 x high temp rise, high current..etc

Remember: Cell 1 had 10 hard cycles at 30A than the cell 2

Ah of both cell at 0.1C:
Cell 1: 10.6Ah
cell 2: 10.7Ah

Wh of both cell at 0.1C
Cell 1: 34.2Wh
cell 2: 34.8Wh

Ah of both cell at 1C:
Cell 1: 10.36Ah
cell 2: 10.60Ah

Wh of both cell at 1C
Cell 1: 30.9Wh
cell 2: 32.1Wh

Ah of both cell at 3.5C:
Cell 1: 10.17Ah
cell 2: 10.60Ah

Wh of both cell at 3.5C
Cell 1: 28.1Wh
cell 2: 30.0Wh

Doc
 

Attachments

  • 1 5 10 20 30 et 35A Wh BOTH CELL_1024x768.JPG
    1 5 10 20 30 et 35A Wh BOTH CELL_1024x768.JPG
    100.9 KB · Views: 1,922
Yeh the second cell is definitely better than the first. From the looks of the graph, the second cell at 3.5C looks better than the first at 3C. :mrgreen:

Good job Doc.
 
dimitrib90 said:
Yeh the second cell is definitely better than the first. From the looks of the graph, the second cell at 3.5C looks better than the first at 3C. :mrgreen:

Good job Doc.
:wink:

do you want harder tests :twisted:

Doc
 
Doctorbass said:
dimitrib90 said:
Yeh the second cell is definitely better than the first. From the looks of the graph, the second cell at 3.5C looks better than the first at 3C. :mrgreen:

Good job Doc.
:wink:

do you want harder tests :twisted:

Doc

Sure why not!! :twisted:
 
doc, there is an extra line which comes out of the 30A discharge on the two cell overlay, what is that? is it the 35A trace for cell #2?

i assume the idea of even higher current discharges would increase the apparent decrease in performance of cell #1? that is the operating assumption, so if continued extreme discharge affects cell#1 even further, you could confirm it by also destroying cell #2 in the same way to establish it is more than a theory, imo.

so maybe confine the damage to cell #1 and then later do the same to cell #2. can you discharge 50A? 100A?

are you maintaining a history of the IR as you continue to use them up? has it climbed up from your 9mohm estimate?
 
dimitrib90 said:
Doctorbass said:
dimitrib90 said:
Yeh the second cell is definitely better than the first. From the looks of the graph, the second cell at 3.5C looks better than the first at 3C. :mrgreen:

Good job Doc.
:wink:

do you want harder tests :twisted:

Doc

Sure why not!! :twisted:

Ok so lest say 50 and then 70 and maybe 100A?
 
dnmun said:
doc, there is an extra line which comes out of the 30A discharge on the two cell overlay, what is that? is it the 35A trace for cell #2?

i assume the idea of even higher current discharges would increase the apparent decrease in performance of cell #1? that is the operating assumption, so if continued extreme discharge affects cell#1 even further, you could confirm it by also destroying cell #2 in the same way to establish it is more than a theory, imo.

so maybe confine the damage to cell #1 and then later do the same to cell #2. can you discharge 50A? 100A?

are you maintaining a history of the IR as you continue to use them up? has it climbed up from your 9mohm estimate?

The extra line you talk about is the cell number two. read the legend and you will comprehend the graph.

The cell number 1 is not destroyed.. it still have more than 10Ah..
Doing the same 10 added hard run cycles on the number two should affect it by the similar way than the cell number 1 in theory. IL,, need more than a week to do the 10 cycles cause i need couples of hout to charge it and to let it stabilize every cycles..

I will try higher current like 50, 70 or 100A but depending on their temp, i'll shorten or stop the test if they get too hot.

the test i did from now can satisfy a majority of the ebiker here that run at 30-35A... depending on their BMS or controller current limit.. but for sure my tests are CONTINUOUS.. so nobody here use their ebike on full battery discharge at 100% throttle!.. So to be realistic, we could conclude that 15A avg is realistic..

For Extreme ebikers.. i wuold suggest to paralleling these cells for 2 or 3p for sure..!

On this test i did not make the IR test. I inly tested it at the end of all current discharge of the first cel test.

I measured 9 miliohm... this is not an estimate.. this is the real repetable measurement.

I will test the RI of cell no 2 as soon as it is completly charged and that it stabilized for couples of hour.

I dont think their internal resistance will be much affected at the begining of these test. 3.5C may not affect it very much... but.. a brand new cell usually need couples of these cycles to be optimized. .. their internal resistance may decrease a bit and their Ah may decrease a bit too.. it depend on the LIFePO4 quality...

I'm pretty sure i will get around 8.5 to 9miliohm on cell 2.

Doc
 
Test done...

I confirm.. CELL 2 is : 9 miliohms

Doc
 
Doc, were both of these 40138 cells the green type? Have you done any tests with the Grey BMIs? I can send you one if you'd like to test it out.
 
mcstar said:
Doc, were both of these 40138 cells the green type? Have you done any tests with the Grey BMIs? I can send you one if you'd like to test it out.

No i didn't tested the grey one.. You can send it to me no prob PM me
 
mcstar said:
Doc, were both of these 40138 cells the green type? Have you done any tests with the Grey BMIs? I can send you one if you'd like to test it out.

I sent 2 of the recent PSI green sleve cells a few days ago, it would be interesting to see if they are the same as the Grey cells or not.. :)
 
Doctorbass said:
Ok so lest say 50 and then 70 and maybe 100A?

I'd definitely like to see the 5c/50a factory rating - I can't test that high. At least until I get the Bus running, but even that won't be sustained 5c.

-JD
 
pico1 said:
might as well buy a ping pack

Thanks for the chart. Can you expand on this a bit?

- Test conditions and equipment setup?
- Single cell used for all tests?
- Recent production blue plastic wrapped cell (tab or screw) or older bare metal or cardboard wrapped tab cell

If you're testing Ping or PSI cells can you show comparative graphs or stats?

Do you have a repeatable internal resistance measurement that you can confirm so we can compare it to the 9 miliOhm measurement obtained by doctorbass?

Cheers!
 
About user pico1's chart:

It looks as though his tested headway cell is one of the newer ones (blue).

- Using the 2C, 3C, 4C and 5C charts it looks as though the total test resistance is about 11 milli-ohms. This was found using the voltage drop of about 0.11V average per 10A of load current (R_cell = V_drop / I_load). Please note that any additionnal resistance in the test circuit other than the cell itself is also included in this number, so the cell itself will actually be better than this.

- The temperature rise of the cell looks very low, even at 5C the temperature only goes from 75oF to about 95oF - there must have been good cooling! That's only just over 10oC rise at 5C, or 50A!

- The 6C curve looks better than it should be, and the 7C looks pretty darn bad.

So it looks like the 2C-5C curves are what we would expect from these cells. Now maybe pico1 can give us more details about his test setup?

As for comparing to Ping's batteries, I got about 135mOhms DC for a 16 cell series, 20Ah battery. So 135/16 = 8.5mOhm per 20Ah. So this makes 17mohms per 10Ah, quite a lot higher than these newer headway cells. This high internal resistance limits Ping's discharge rates, because resistance makes heat. Cell cooling is important, and Ping's compact prismatic cells aren't mounted to dissipate heat, which probably limits the continous rate of 2C which they are rated at. The headway's ~10mohms per 10Ah per cell will produce significantly less heat than Ping's 17mOhms per 10Ah per cell, about 2.9 times less since it's 1.7X squared.

Pat
 
Back
Top