• Hello ES! We could use some help to get us past the finish line on building the new knowledgebase for the forum.
    Can you donate? Please see our fundraising page. Thank you!

Motor Output Watts For MPH

When I swap tyres I get roughly a 14 percent variation in top rolling speed and 17% difference in watthours per km at 650W on my q100 powered daily commuter.
I deal with companies like Aramid a bit who sell products like Twaron for fuel efficiency in tyres, so it's front of mind for me.

I recently had the unpleasant experience of having to pedal my offroad bike without power and extremely knobby maxxis wheels. Nearly killed me.
On my 28mm road tyred commuter with 120 psi tyres I'd not have been too troubled.

Seems to be a common affliction that gets much discussion when on group rides with other ebikers here in Vic. Must be a local phenomenon.
 
DrkAngel said:
Upgraded graph with a generic Rolling Resistance chart line.

file.php

At 50mph the rolling resistance is approximately 3.5% of the energy required from "Mountain Bike".
Near 50mph, rolling resistance accounts for between 3 and 5% of total energy.
Variance between medium and top performance tires might account for less than 1% of energy requirement or less than .5mph. (at 50mph)

Below 15mph rolling resistance can be the major factor, but above 20mph, wind resistance increasingly pushes rolling resistance into virtual insignificance!
 
full-throttle said:
DrkAngel said:
Variance between medium and top performance tires might account for less than 1% of energy requirement
Really?? Where did you get that figure from?

Shown in graphs and clearly explained ...
DrkAngel said:
Near 50mph, rolling resistance accounts for between 3 and 5% of total energy.
Variance between medium and top performance tires might account for less than 1% of energy requirement or less than .5mph. (at 50mph)

Below 15mph rolling resistance can be the major factor, but above 20mph, wind resistance increasingly pushes rolling resistance into virtual insignificance!
Try reading-quoting the entire sentence.
 
Samd said:
I asked what the difference was in assumption between the bike curves. Ah hell. Getting kinda hilarious.
I'm a bit at a loss - in the post above, I gave specific CdA and Cr values for several frame configurations as well as sample Cr values for different road surfaces.

The calculation in Justin's simulator is conventional and it seemed more reasonable to couch the discussion in terms of that tool simply because it is available to all. The values there will allow 'What If' analysis using the same app to get both load line and motor power curves. Putting the calculation into Excel is straightforward and yields identical curves. Plug in the values stated above and generate the 'Mountain Bike', etc curves yourself. Set the rolling resistance values as you deem appropriate.

If you wish to use other more specific Cr values, you might find your tires in this data set.
View attachment JLRollRes.xls
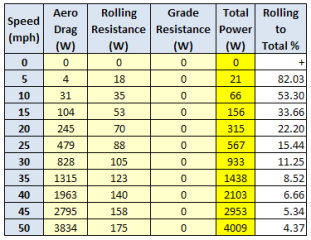
Here is an example of specific values at different speeds for a mountain bike as defined in the simulator - it shows the more pronounced effect of rolling resistance at low speeds (notably below 25mph). Looking at specific tire Cr values in the Excel file above and the percentages in this table, you can get some notion of the percentage impact of various tire types as various speeds. It seems that the road surface may have as large or larger effect than tire type.

LoadLineCalculationTermsWithPercentage.png

EDIT - I see there was a flock of posting while I was typing - ignore any or all of this post if it's not relevant.... oops.
...Although the large proportion of rolling resistance at low speeds shown in the table above may help explain this observation (look at the actual rolling resistance wattage - figure knobbies are worse - then compare to an estimate of your human pedaling wattage):

Samd said:
I recently had the unpleasant experience of having to pedal my offroad bike without power and extremely knobby maxxis wheels. Nearly killed me.
On my 28mm road tyred commuter with 120 psi tyres I'd not have been too troubled.
 
DrkAngel said:
DrkAngel said:
At 50mph the rolling resistance is approximately 3.5% of the energy required from "Mountain Bike".
Near 50mph, rolling resistance accounts for between 3 and 5% of total energy.
Variance between medium and top performance tires might account for less than 1% of energy requirement or less than .5mph. (at 50mph)

Below 15mph rolling resistance can be the major factor, but above 20mph, wind resistance increasingly pushes rolling resistance into virtual insignificance!

Okay, at this point I'll step back in...
road-tire-rolling-resistance.gif


All of these tyres are sold as either race, high end road tyres, and just in this elite category, there is a 100% difference between the best and the "worst".

Someone mentioned earlier that rolling resistance scales linearly. In that case, the worst tyre on that list would be losing 129W @ 50mph, while the best would be losing 67W, a difference of about 60W.

On a road bike, you need 3000W to achieve 50mph, so we're talking about 2% for the best tyre or 4% for the worst tyre. All good so far.

Of course, once we start throwing in mountain bike tyres, it's a different kettle of fish. I can't find one that has the same review methodology, so it's harder to compare, but it seems that losing 100w isn't out of the question on road, and the number gets ridiculous on dirt.

Food for thought anyway.
 
Yeah, I'm thinking that 25 watts takes a lot of miles to add up to much difference. If your battery lasts a whole hour, you just lost a whopping 25 wh. :cry:

It takes very light pedaling effort to make up for that 25 w. In many cases, just pedaling more and throttling less on starts will do the trick.

I pick tires based on what I can afford, and how much I want to crash. The choice matters plenty when you are limited to pedaling, but with a motor and a reasonable size battery, you can run any tire that suits your other tire choice needs best.

Are you thinking that rolling resistance varies with speed? I don't think so. but obviously the aerodynamic differences would increase at 50 mph. So the fat knobby should be a poor choice for a 50 mph bike that is trying to maximize efficiency.
 
DrkAngel said:
full-throttle said:
DrkAngel said:
Variance between medium and top performance tires might account for less than 1% of energy requirement
Really?? Where did you get that figure from?

Shown in graphs and clearly explained ...
DrkAngel said:
Near 50mph, rolling resistance accounts for between 3 and 5% of total energy.
Variance between medium and top performance tires might account for less than 1% of energy requirement or less than .5mph. (at 50mph)

Below 15mph rolling resistance can be the major factor, but above 20mph, wind resistance increasingly pushes rolling resistance into virtual insignificance!
Try reading-quoting the entire sentence.

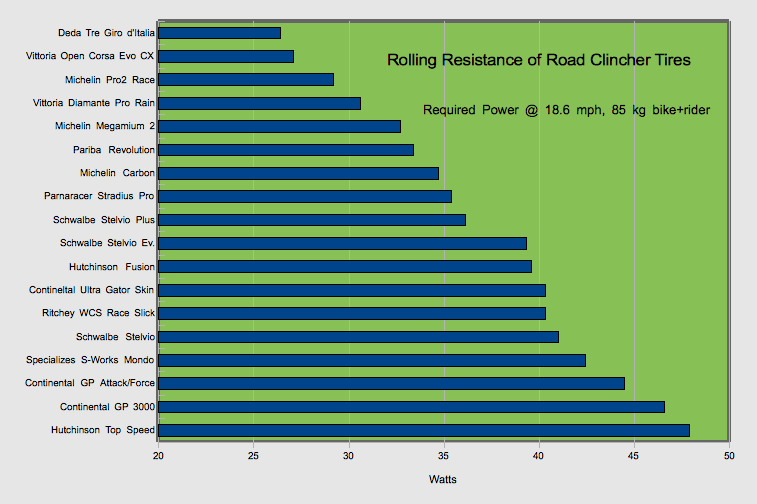
Based on "Rolling Resistance of Road Clincher Tires"
Best low rolling resistance is 27w @18.6mph.
Median low rolling resistance is 37w @18.6mph.


At 50mph ...
Rolling resistance is 72.5w vs 99.5w ... or 27w difference.
This 27w difference is less than 1% of the 3000w required to motivate a race bike at 50mph.

Oh! ... rolling resistance is 3.1% and 3.3% of the total energy for 50mph, based on these tires.
 
DrkAngel said:
Based on "Rolling Resistance of Road Clincher Tires"
Best low rolling resistance is 27w @18.6mph.
Median low rolling resistance is 37w @18.6mph.
...
Rolling resistance is 72.5w vs 99.5w ... or 27w difference.
This 27w difference is less than 1% of the 3000w required to motivate a race bike at 50mph.
Oh! ... rolling resistance is 3.1% and 3.3% of the total energy for 50mph, based on these tires.
The table of clincher tire rolling resistance power is small and for only a very small fast tire group. Further, the test weight is only 85kg for bike and rider - not really applicable to the typical ebike situation. Your estimates above are for very high speed - where the contribution of rolling resistance will appear small relative to the total load line power. All this presents only select data points in the worst possible light to arrive at the 1% figure.

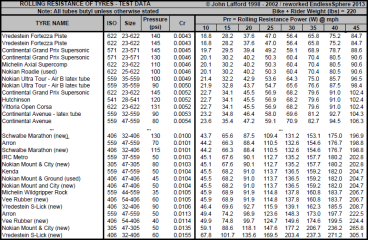
Here is an excerpt of data derived from the data set I posted above of 200 tire types. The image shows tires with some of the best and worst Cr values at a variety of speeds:

JLDataExcerpt.png
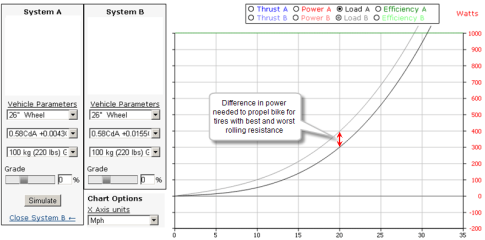
Here is a simulator run for a mountain bike with 220lb load with the best and worst Cr values - the difference between tires is meaningful at the 20-25mph range (roughly 20-25% of the total power needed to propel the bike).

JLDataExcerpt2.png
There is no magic calculation here - anyone can plug these values into the simulator and examine these or similar comparisons - with or without specific motor/electronics configurations.

Sadly, there is a dearth of available CdA and Cr data, particularly for non-road bikes where interest in maximizing speed is not so great. Beyond that, the variation in testing procedures is wide - from rolling tires on a test road to driving them with small drums that distort the contact patch. The tire dataset posted above is large and at least has a consistent test technique making relative evaluations possible. That said, the data is old and compounds and tread details may differ today. However, there is still value at least to determine ballpark mean/median values.

The difficulty in getting values for CdA and Cr was one of the reasons that using the simulator to create these curves seemed reasonable. CdA and Cr make clear contributions at 'average' riding speeds and the simulator uses well-known standard calculations. It allows use of some 'typical' frame profiles (or custom) so that evaluations of expected speed for motor/controller/battery configurations are easy and at least consistent (see previous post).

IMHO ignoring rolling resistance as inconsequential is not well advised for builders interested in cruising speeds in the 20-30mph range. Using a 'typical' value will generally work okay in light of errors introduced by other approximations, but if specific Cr data can be located, it seems that the accuracy of the simulator results can be measurably improved as demonstrated in this sample run.

EDIT - Interestingly, for this dataset: Cr(mean) = 0.0074 and Cr(median) = 0.0070
The mean value is very close to the 0.008 default value used by the simulator for mountain and road bikes.
 
Cheers teklektik, the data is what I was after. Comparing appropriate tyres @ realistic speeds makes sense.
The other guy should go easy on caffeine :roll:
 
FT-
I think DA had a good idea in creating the plots, but since the simulator does the identical calculations and plots, it just seemed like pointing out a little 'how to' might be helpful. As for the rest of it - well - the simulator does the complete calculation including the equation terms for rolling resistance and grade, so might as well use them...

Anyhow - for folks who are not Excel-frisky, here's a PDF of the reworked Excel data posted above. All critical base data (Cr values, etc) are unchanged from the original, but the bike+rider weight has been increased to 100kg and the sample speed columns have been recalculated to yield a more interesting range - or pop the Cr into the simulator and have at it... :D

View attachment JLRollRes-reworked2.pdf
BTW - For those who have been wondering why the Cr for only one wheel is plugged into the calculations (or simulator) for a two wheeled vehicle:
  • Rolling resistance varies linearly not only with speed but also with weight (mass), so the rolling resistance of two wheels each carrying half the weight is the same as one wheel carrying all the weight - same deal for a trike - so assuming the same Cr for all wheels lets us simplify to the equivalent single wheel calculation. In the general case for mixed tires/wheels, a composite Cr could be calculated using a weighted average of the Crs of each tire according to the portion of overall weight each tire carries - a complication not worth our time here, but that's the idea...
 
I was recently reviewing the procedures for aligning motorcycle wheels. I wonder what the numbers look like for typical customers' bicycles. Chalo?
 
I usually go by a 'every 5mph more requires almost twice the power' rule of thumb for mountain bikes, so when someone asks for a 35mph setup I say why not 30mph and save yourself some significant battery expense/weight?

I also don't think mountain bikes handle well past 30 anyway.
 
gogo said:
I was recently reviewing the procedures for aligning motorcycle wheels. I wonder what the numbers look like for typical customers' bicycles. Chalo?

I'm not sure what numbers you mean, but bicycle wheels are rarely aligned in the same plane unless a concerned and skilled human has gone lengths to make them so. First you have to align the frame, then true and correctly dish the wheels, then fasten the wheels repeatably and consistently to the frame.

Fortunately, bicycles are very forgiving of small misalignments, and they operate almost as well in a slightly compromised condition as they do when painstakingly set up. (At least with regard to wheel alignment.)

If you are talking rolling resistance, approximately none of my customers care very much about that. Most put cost as the first priority, followed by puncture resistance. Most of the rest are concerned exclusively about puncture resistance, with the remainder concerned primarily with cosmetics (e.g. color, tread pattern, tire width for appearance reasons). It's rare for a customer of mine to be interested in anything other than one of the above three factors when choosing a tire.
 
Chalo said:
If you are talking rolling resistance, approximately none of my customers care very much about that. Most put cost as the first priority, followed by puncture resistance. Most of the rest are concerned exclusively about puncture resistance, with the remainder concerned primarily with cosmetics (e.g. color, tread pattern, tire width for appearance reasons). It's rare for a customer of mine to be interested in anything other than one of the above three factors when choosing a tire.
I agree, Tires (Tyres) - their rolling resistance, is a secondary, if even that important, consideration for most.
Especially with an electric assist bike, high speed street or off-road high traction determine the tire type.

If someone needs a massive, knobbly, low pressure tire they must accept the weight and poor RR factor.

If they want low RR ... they must accept the high pressure, harsh ride, low traction, high price trade-offs.

Rolling resistance variances within the same tire type, tread, pressure, are comparatively minor.


On the other hand, I do see the advantage of paying 10 times the amount for tires that save a few watts ... for a racing bike (human powered only).

On the other - other hand ...
An acquaintance, on his home built recumbent trike, stopped at my shop to show it off ...
He paid a goodly amount for thin, low RR 150 psi tires ... but was running them at < 40 psi!
Worst was his rear 700C x 23 with flat center rib.
Pressure was so low that, rather than riding on the center rib, he was dragging his sidewalls ...
Rolling Resistance might have been 10x of it's best capable.

So, while I am not overly concerned at RR, I do choose the type tire for the job by size, tread and tire pressure.
Most importantly, I check tire pressure daily, by feel, and often by pressure gauge.
 
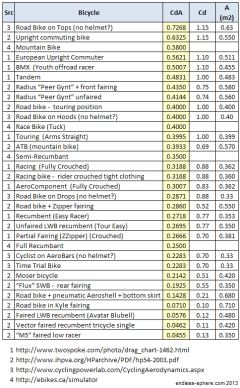
Here's a summary of CdA data referenced in this thread and elsewhere for folks who wish to run custom Load Line or motor analysis in Justin's simulator as described in an earlier post. No effort has been made to consolidate or normalize the values so any apparent conflicts are left for reader to resolve :D

CdA-Summary2.png
Thanks to DA and his Aero thread for leading to some valuable reference sources.
Cr tire data (somewhat dated) is available in a previous post.
 
John in CR said:
Maybe it's just me, but I find the calculator at http://www.kreuzotter.de/english/espeed.htm significantly more useful than graphs based on mostly unknown arbitrary assumptions.

That's a really useful link - now bookmarked - thanks for that. The graphs here I found useful for a quick reference point, and also to clearly show the exponential power requirement to achieve higher speed, and showing comparisons between different bike types.

For an accurate reading of estimated top speed - a proper calculator like the one you posted is definitely required!
 
Back
Top