sendler2112
100 kW
billvon said:Yep. I have a poster like that in my office. But it showed new discoveries ending in 2000, and peak oil happening in 2010.
Yes. Just as it was once built on VERY cheap labor (slavery.) We moved on.Our modern economy was built on $20 oil not $200.
Yes. Fossil slaves freed the human slaves. Each person in the US has the energy equivilent of 200 fossil slaves standing behind them doing their bidding. Let's try not to return to human slavery when fossil fuels( and essential elements) run out.
.
.

.
.
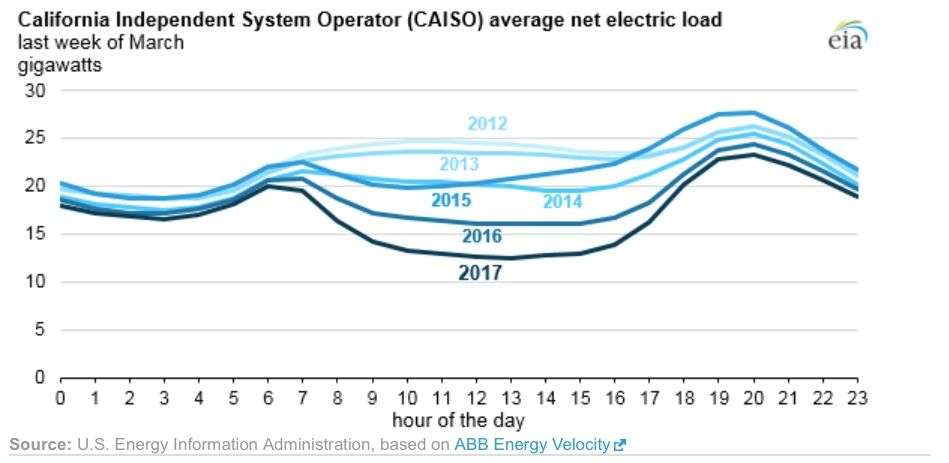
") My assumption is that4 hrs is chosen for a reason rather than arbitrarily, based on cost. I figure it bridges the gap from dusk through the evening peak demand. Once into night-time, demand ought to have fallen sufficiently for baseload generation to cover it (wind & gas, to my mind).
My assumption is that4 hrs is chosen for a reason rather than arbitrarily, based on cost. I figure it bridges the gap from dusk through the evening peak demand. Once into night-time, demand ought to have fallen sufficiently for baseload generation to cover it (wind & gas, to my mind).