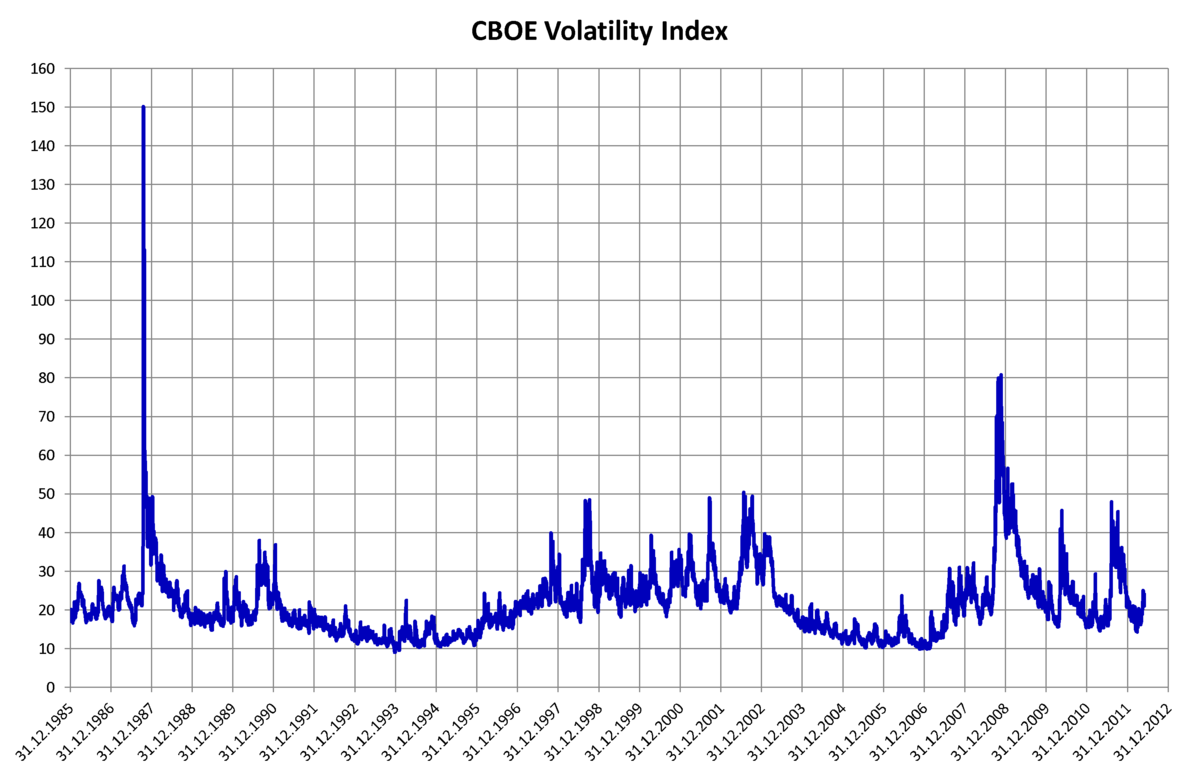
Interesting, vix index. Said to be widely considered to measure fear.
Looks like there's often a run up in the vix upto about a year before a crash.
And looking at this picture of the dot-com bubble, it looks like there's often a semi major retreat within 3-6 months of an initial crash, but it completely gives away within 6 months and largely concludes within a year.
Corresponds to the timing of the runup in the VIX.
So a short on the stock market now would probably be for about a year.
I wonder if the SPDN would be a good tool here for a year long short?
I'd almost think it'd be better than trading on margin, with the interest fees probably higher than 5%.
Damn, look at the dotcom bubble, from 5000 to nearly 1000...
Holy crap, wow.
I suspect the crash of 2009 would've been similar if the feds hadn't intervened...
Instead it went from ~14000 to ~7000...
I suspect this one is going to fall hard. "The taller they are, the harder they fall"
And it was purposely engineered by QE money to be as tall as possible.
So the dotcom peak was 5000, and the 2009 peak was 14000.
Where did all that extra money come from?
I would say the current peak of 26,000 came from QE money, but that doesn't explain the substantially higher 2009 peak compared to the 2000 peak.
Maybe it's from the increased concentration of wealth... suspect some foreign capital investment by the chinese too...
And, there was a lot of high dollar real estate loans being made on the back of chinese investors and america investors via real estate derivatives/packages wasn't there? Much of that newly created loan money probably made its way back into the stock market...
Let's consider the possibility it's going to surge back up like it did back in late 1998.
Looks like it dropped from 2000 to 1600, a similar proportional drop, before continuing to ratchet back up to 5000.
The vix was spiking around then too.
How can we tell it's not doing that this time?
Wait... what is that dotcom bubble image showing exactly?
Because it looks like the DJIA actually went from 11100 to 7500 during 1998-2002 looking at https://finance.yahoo.com/quote/%5EDJI/chart?p=%5EDJI#eyJpbnRlcnZhbCI6Im1vbnRoIiwicGVyaW9kaWNpdHkiOjEsInRpbWVVbml0IjpudWxsLCJjYW5kbGVXaWR0aCI6MTMuMDcxNDI4NTcxNDI4NTcxLCJ2b2x1bWVVbmRlcmxheSI6dHJ1ZSwiYWRqIjp0cnVlLCJjcm9zc2hhaXIiOnRydWUsImNoYXJ0VHlwZSI6ImxpbmUiLCJleHRlbmRlZCI6ZmFsc2UsIm1hcmtldFNlc3Npb25zIjp7fSwiYWdncmVnYXRpb25UeXBlIjoib2hsYyIsImNoYXJ0U2NhbGUiOiJsaW5lYXIiLCJwYW5lbHMiOnsiY2hhcnQiOnsicGVyY2VudCI6MSwiZGlzcGxheSI6Il5ESkkiLCJjaGFydE5hbWUiOiJjaGFydCIsInRvcCI6MH19LCJzZXRTcGFuIjp7fSwibGluZVdpZHRoIjoyLCJzdHJpcGVkQmFja2dyb3VkIjp0cnVlLCJldmVudHMiOnRydWUsImNvbG9yIjoiIzAwODFmMiIsImN1c3RvbVJhbmdlIjp7InN0YXJ0Ijo4Nzg1MzY4MDAwMDAsImVuZCI6MTA1OTcxNDAwMDAwMH0sInN5bWJvbHMiOlt7InN5bWJvbCI6Il5ESkkiLCJzeW1ib2xPYmplY3QiOnsic3ltYm9sIjoiXkRKSSJ9LCJwZXJpb2RpY2l0eSI6MSwiaW50ZXJ2YWwiOiJtb250aCIsInRpbWVVbml0IjpudWxsLCJzZXRTcGFuIjp7fX1dLCJzdHVkaWVzIjp7InZvbCB1bmRyIjp7InR5cGUiOiJ2b2wgdW5kciIsImlucHV0cyI6eyJpZCI6InZvbCB1bmRyIiwiZGlzcGxheSI6InZvbCB1bmRyIn0sIm91dHB1dHMiOnsiVXAgVm9sdW1lIjoiIzAwYjA2MSIsIkRvd24gVm9sdW1lIjoiI0ZGMzMzQSJ9LCJwYW5lbCI6ImNoYXJ0IiwicGFyYW1ldGVycyI6eyJoZWlnaHRQZXJjZW50YWdlIjowLjI1LCJ3aWR0aEZhY3RvciI6MC40NSwiY2hhcnROYW1lIjoiY2hhcnQifX19fQ%3D%3D
So the 1999 DJIA peak: 11000 Min: 7500
2008 peak: 14000 Min: 7000
2018 peak: 26000 Min: ????
Wow, that's been some massive money printing.
I want to know what that dotcom bubble image is showing... maybe I need to be betting against that index...
Oh, the Nasdaq Composite. IXIC
2000 peak: 5000 Min: 1200
2008 peak: 2500 Min: 1200
2018 peak: 7500 Min: ???
Looking at the numerical trend here, I think I want to bet against the IXIC!
Nasdaq appears to be "more tech heavy", thus potentially more volatile during tech market peaks, like shown above during the dotcom bubble.
Would I think we have a tech bubble this time...
Probably more like 2008... so either DJI or Nasdaq short would probably work.
https://www.nasdaq.com/article/3-ways-to-short-nasdaq-with-etfs-cm578081
As a caveat, investors should note that such products are suitable only for short-term traders as these are rebalanced on a daily basis (see: all the Inverse Equity ETFs here ).
Don't understand the importance of that caveat, but seems like I should.
https://www.investopedia.com/articles/financial-advisors/082515/why-leveraged-etfs-are-not-longterm-bet.asp
A good explanation, I think, as to the main reason why inverse etfs aren't meant longterm. Should take sometime to understand this.
Inverse ETFs aren’t designed to be held overnight
Although it seems pretty simple at first glance, this is actually a tricky trade that requires considerable skill because inverse ETFs rebalance daily. In other words, all price movements are calculated on a percentage basis for that day and that day only. The next day you start all over from scratch.
Here’s an example of beta slippage or how daily rebalancing can throw a monkey wrench into your expected profit and loss calculations and cause worse-than-expected returns.Imagine you pay $100 for one share of an inverse ETF based on an index that’s currently at 10,000. Since you’ve bought an inverse ETF, you’re hoping the value of the index goes down so your ETF goes up in value. That same day, the index falls 10% and closes at 9,000. As a result, your share will increase 10% to $110.
Here’s the catch: daily rebalancing means the next day you start over from scratch. If the index opens at 9,000 and then makes a bullish move, closing at 10,000, that’s an increase of 11.11%. Your inverse ETF will decrease in value by that same percentage, and as a result, your share will go down from $110 to $97.78 (11% of $110 is $12.221).
Failure to understand how daily rebalancing affects inverse ETFs can wreak havoc on traders who try to hold them over longer periods of time. Although Ally Invest doesn’t promote day trading, inverse ETFs are intended as an intra-day trade. Trading on a daily basis can lead to more transaction costs.
If you decide to hold a position in an inverse ETF for longer than one day, at a minimum you should monitor your holdings daily. You must realize if you hold an inverse ETF over multiple trading sessions, one reversal day could not just obliterate any gains you’ve racked up, you could find yourself suddenly (and unexpectedly) facing a loss.
So... I see...
the percentages are compounded, day to day.
So a 1000 point gain has more weight than a 1000 point drop from some number.
A number of daily gains can easily outweigh the daily drops due to the heavier weighting of the gains over the losses.
So if one is planning on holding inverse etfs longterm... you better be sure it's going down down down...
Since I think there'a high likelihood of retreat within the next 6 months.
I probably shouldn't try to hold an inverse etf longterm.
Well, then, is there any suitable way to do a longterm short? Or is that some kind of fantasy?
http://magazine.globeinvestor.com/static/intro/text/school_24.html
Oh, looks like you can short a stock which then requires margin requirements. Placing money into the account.
Looks like shorting $5000 requires $2500 to be placed into the account with 150% margin requirement.
Then if I were to short $20000, I'd need to place $10000 into the margin account.
It doesn't look like there's interest charges on this "borrowed stock". The brokerage, however, earns interest on the free money sitting in the margin account.
The idea with the $20000 short is that the stock will fall to $10000, which case I buy it back...
So, I make $10000 shorting $20000 of stock.
Make $10000 using $10000.
I make more if the margin requirements are less... like 130%... then I can short more stock with a given amount of money in the margin account.
I wonder if robinhood does shorting?
Now back to the question "are we in 1998 right now, and there's still more to go before it peaks in 2000"?
What kind of fervor are we in, exactly?
No specific industry as far as I can tell.
Although, the NASDAQ does look relatively hot at 7500. IXIC
Not quite at 10000 if I were to expect it to be comparable to the DJIA peak for a "full blown dotcom bubble", but considerably above 5000, so there's definitely some weighting in tech stocks above 2008's peak.
So, I'd think IXIC would be a good candidate for a year long short.
And damn... robinhood doesn't support short selling.
Looks like I need to continue with that ALLY application.