
Toshi
10 kW
I. A warning to readers
Advance warning: click "back" or "next" if you're not at all interested in electric vehicles or their energy use. This is a long, wonkish post, let the audience (as it were) be warned.
II. Introduction, Importance, and Scope
Still here? This post regards the charmingly named "Well-to-Wheels Analysis of Energy Use and Greenhouse Gas Emissions of Plug-In Hybrid Electric Vehicles", just released in June 2010 by the Argonne National Laboratory. It's essentially an updated, more comprehensive version of the 2000 MIT Energy Lab study that I cited in my April 2009 post, "Do electric cars make environmental sense?"
What does this paper actually examine? From its executive summary (emphasis mine):
III. Plug-to-Wheels Analysis
Now that we have established "why," onto "what," the data.
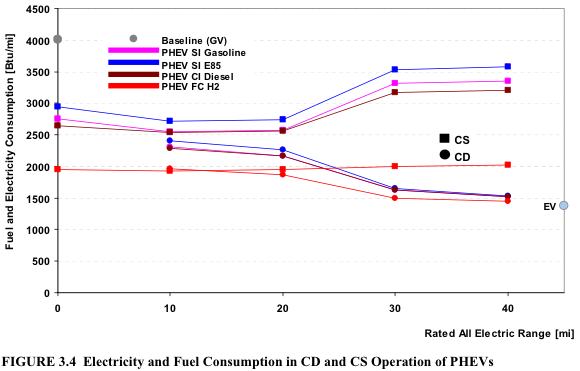
What does this graph mean? I first direct your eye towards the grey circle just about the 4000 mark on the y-axis: that's the energy consumption per mile of a baseline future gasoline engine automobile. Now take a gander at the blue circle at the bottom right of the graph marked "EV": that's the energy consumption per mile of a pure battery electric vehicle (aka BEV; imagine an evolved Nissan Leaf with a 150 mile range and you wouldn't be far off). Note that the energy consumption of the BEV is well under half of that of the conventional gasoline vehicle. Shift your eye to the magenta circle in the 40-mile range column and you can see that the efficiency of the Volt-like vehicle in its initial 40 miles of range is almost indistinguishable from that of the BEV, not terribly surprising. Another interesting data point on this graph is of the magenta square at the 40 mile-range mark on the x-axis, which corresponds to the efficiency of the Volt-like vehicle in charge-sustaining mode, that is, the mode that you'd run in after driving 40 miles. This point shows that the Volt-like vehicle after its initial 40 miles of range is about 15% better than that of a conventional gasoline vehicle. Also note, however, that the magenta square at 40 miles of all electric range is higher than the magenta square at 0 miles: in other words, a non-plug in gasoline electric hybrid like the Prius will be more efficient than a Volt after the 40 mile point.
We're not nearly done yet, even though these findings are interesting, because these relate vehicle miles to energy, which in turn is not equivalent to greenhouse gas emissions due to the sundry ways of generating that same energy in the first place. That is, this is a "power plug to the vehicle's wheels" analysis, whereas the more important question is of "well-to-wheels" energy use and carbon dioxide emissions. After all, why would we want to switch to BEVs if total CO2 production increased as a result?
IV. Energy Generation Variation by Region
In order to conduct a well-to-wheels analysis one must model or make assumptions about how the energy gets from the proverbial well to the power plug. One of the conclusions that I came to in my earlier post, and that this study comes to currently, is that it matters greatly where one lives, as the regional mix of power generation will have profound effects on the total system energy use and CO2 production. It also matters when the vehicles are charged, not just where, as the additional power generation capacity that would be brought on-line during the daytime is much dirtier than the power generation mix at nighttime, when loads are low and excess capacity is rife.
The study examines four regional areas in detail (WECC which encompasses California and the Pac NW/New England/NY/Illinois), looking at the mix (coal/natural gas/nucs/wind/nuclear/etc.) of power generation under a variety of vehicle charging scenarios. Suffice it to say that the increased demand of charging EVs will be met by various means in different regions, and that the mix of power differs by charging time.
What are these "various means" of generating the extra power? Here the answer is a bit complicated. For those following along in the text the data are in Table 6.1. My very shallow summary of this table is that if BEVs and PHEVs are charged at night then the extra power will be generated largely by coal in Illinois; mainly by clean natural gas with some input from coal in the WECC/Western states region; and almost entirely by clean and not so clean natural gas both in the Northeast and in NY state.
What does this mean in terms of well-to-wheels energy usage and greenhouse gas emissions, you ask? Read on for the conclusion of this riveting tale.
V. Well-To-Wheels Energy Use and Greenhouse Gas Emissions
To me, the first really surprising conclusions of this paper are from this following figure, excerpted from Figure 6.6:
The important lines to note are the one at top for the conventional/non-hybrid gasoline vehicle, the red dotted line for the gasoline hybrid-electric vehicle (e.g., Toyota Prius), and the various columns for GHG emissions of a Chevy Volt-type PHEV 40 used in charge-depleting mode (ie, in the first 40 miles of range). What can we conclude from this figure?
First off, if you're in coal-heavy Illinois you shouldn't drive a Chevy Volt, as your well-to-wheels GHG emissions will be almost that of a conventional gasoline car, and quite a bit above the non-plugin hybrid-electric gasoline car (say, Toyota Prius). In other states the Prius and the Volt-in-its-first-40-miles-of-range are essentially a wash except in California, where the Volt "wins" because California's electric power is cleaner than that found elsewhere.
However, the story doesn't end here, as real-world usage of the Volt won't just be in its first 40 miles of charge-depleting range. In combined use that is both charge-depleting (first 40 miles) and charge-sustaining (after 40 miles) usage one can see that PHEVs don't really offer any meaningful reduction in well-to-wheels GHG emissions when compared to a non-plugin Toyota Prius even when using the squeaky-clean California power mix:
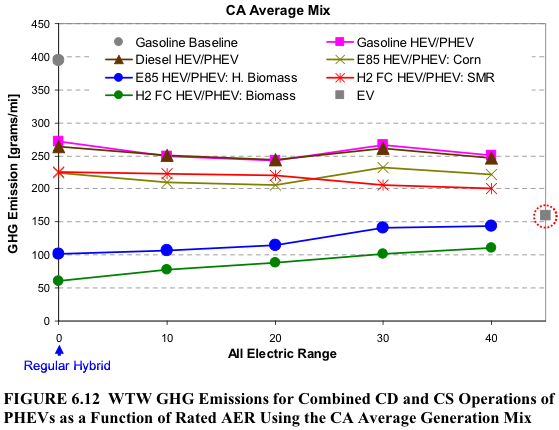
How to interpret the above: the leftmost magenta square is a 0-EV-only-mile range gasoline-electric hybrid: a Prius, essentially. The rightmost magenta square is a PHEV 40: a Chevy Volt, more or less. The rightmost grey square with the dotted red circle around it is a pure BEV, a 150-mile range Nissan Leaf, if you will. Note that the slope of the magenta line across the various PHEV ranges is basically null: in other words in combined use the Volt has only a negligible reduction in well-to-wheels GHG emissions when compared to a Prius. Also note that the well-to-wheels GHG emissions of a pure BEV like the Leaf-on-steroids is about half that of either the Volt or the Prius.
VI. Conclusions
I'd say the results of this study are a pretty clear "win" for BEVs, and a pretty clear failure for the case of PHEVs. In the best case of California clean power generation and charge-depleting use in the first 40 miles of its range the 2015-spec Volt is as clean as a BEV in terms of well-to-wheels GHG emissions. In every other case (outside 40 miles of range, power less clean than that of California) the 2015-spec Prius at least matches the Volt and in some cases even beats it outright.
Given my interpretation I find it curious that the authors instead conclude that PHEVs can lead to reduced GHG emissions and energy usage… when compared to conventional gasoline vehicles. I find this conclusion of theirs disingenuous, as when comparing (rightly, in my opinion) to non-plugin gasoline electric hybrids like the Toyota Prius then one sees that the environmental case for PHEVs basically falls flat on its face. I can only speculate why the authors didn't emphasize this point more.
Advance warning: click "back" or "next" if you're not at all interested in electric vehicles or their energy use. This is a long, wonkish post, let the audience (as it were) be warned.
II. Introduction, Importance, and Scope
Still here? This post regards the charmingly named "Well-to-Wheels Analysis of Energy Use and Greenhouse Gas Emissions of Plug-In Hybrid Electric Vehicles", just released in June 2010 by the Argonne National Laboratory. It's essentially an updated, more comprehensive version of the 2000 MIT Energy Lab study that I cited in my April 2009 post, "Do electric cars make environmental sense?"
What does this paper actually examine? From its executive summary (emphasis mine):
"PHEVs have been touted for their potential to reduce the U.S. transportation sector’s dependence on petroleum and cut greenhouse gas (GHG) emissions … . A well-to-wheels (WTW) analysis  which examines energy use and emissions from primary energy source through vehicle operation  can help researchers better understand the impact of the upstream mix of electricity generation technologies for PHEV recharging, as well as the powertrain technology and fuel sources for PHEVs. …
"Argonne employed detailed dispatch models to simulate the electric power systems in four major regions of the United States: … . Argonne also evaluated the U.S. average generation mix and renewable generation of electricity for PHEV and BEV recharging scenarios to show the effects of these generation mixes on PHEV WTW results.
"The primary conclusion is that electrification of transportation significantly reduces petroleum energy use, but GHG emissions strongly depend on the electricity generation mix for battery recharging."
III. Plug-to-Wheels Analysis
Now that we have established "why," onto "what," the data.
What does this graph mean? I first direct your eye towards the grey circle just about the 4000 mark on the y-axis: that's the energy consumption per mile of a baseline future gasoline engine automobile. Now take a gander at the blue circle at the bottom right of the graph marked "EV": that's the energy consumption per mile of a pure battery electric vehicle (aka BEV; imagine an evolved Nissan Leaf with a 150 mile range and you wouldn't be far off). Note that the energy consumption of the BEV is well under half of that of the conventional gasoline vehicle. Shift your eye to the magenta circle in the 40-mile range column and you can see that the efficiency of the Volt-like vehicle in its initial 40 miles of range is almost indistinguishable from that of the BEV, not terribly surprising. Another interesting data point on this graph is of the magenta square at the 40 mile-range mark on the x-axis, which corresponds to the efficiency of the Volt-like vehicle in charge-sustaining mode, that is, the mode that you'd run in after driving 40 miles. This point shows that the Volt-like vehicle after its initial 40 miles of range is about 15% better than that of a conventional gasoline vehicle. Also note, however, that the magenta square at 40 miles of all electric range is higher than the magenta square at 0 miles: in other words, a non-plug in gasoline electric hybrid like the Prius will be more efficient than a Volt after the 40 mile point.
We're not nearly done yet, even though these findings are interesting, because these relate vehicle miles to energy, which in turn is not equivalent to greenhouse gas emissions due to the sundry ways of generating that same energy in the first place. That is, this is a "power plug to the vehicle's wheels" analysis, whereas the more important question is of "well-to-wheels" energy use and carbon dioxide emissions. After all, why would we want to switch to BEVs if total CO2 production increased as a result?
IV. Energy Generation Variation by Region
In order to conduct a well-to-wheels analysis one must model or make assumptions about how the energy gets from the proverbial well to the power plug. One of the conclusions that I came to in my earlier post, and that this study comes to currently, is that it matters greatly where one lives, as the regional mix of power generation will have profound effects on the total system energy use and CO2 production. It also matters when the vehicles are charged, not just where, as the additional power generation capacity that would be brought on-line during the daytime is much dirtier than the power generation mix at nighttime, when loads are low and excess capacity is rife.
The study examines four regional areas in detail (WECC which encompasses California and the Pac NW/New England/NY/Illinois), looking at the mix (coal/natural gas/nucs/wind/nuclear/etc.) of power generation under a variety of vehicle charging scenarios. Suffice it to say that the increased demand of charging EVs will be met by various means in different regions, and that the mix of power differs by charging time.
What are these "various means" of generating the extra power? Here the answer is a bit complicated. For those following along in the text the data are in Table 6.1. My very shallow summary of this table is that if BEVs and PHEVs are charged at night then the extra power will be generated largely by coal in Illinois; mainly by clean natural gas with some input from coal in the WECC/Western states region; and almost entirely by clean and not so clean natural gas both in the Northeast and in NY state.
What does this mean in terms of well-to-wheels energy usage and greenhouse gas emissions, you ask? Read on for the conclusion of this riveting tale.
V. Well-To-Wheels Energy Use and Greenhouse Gas Emissions
To me, the first really surprising conclusions of this paper are from this following figure, excerpted from Figure 6.6:
The important lines to note are the one at top for the conventional/non-hybrid gasoline vehicle, the red dotted line for the gasoline hybrid-electric vehicle (e.g., Toyota Prius), and the various columns for GHG emissions of a Chevy Volt-type PHEV 40 used in charge-depleting mode (ie, in the first 40 miles of range). What can we conclude from this figure?
First off, if you're in coal-heavy Illinois you shouldn't drive a Chevy Volt, as your well-to-wheels GHG emissions will be almost that of a conventional gasoline car, and quite a bit above the non-plugin hybrid-electric gasoline car (say, Toyota Prius). In other states the Prius and the Volt-in-its-first-40-miles-of-range are essentially a wash except in California, where the Volt "wins" because California's electric power is cleaner than that found elsewhere.
However, the story doesn't end here, as real-world usage of the Volt won't just be in its first 40 miles of charge-depleting range. In combined use that is both charge-depleting (first 40 miles) and charge-sustaining (after 40 miles) usage one can see that PHEVs don't really offer any meaningful reduction in well-to-wheels GHG emissions when compared to a non-plugin Toyota Prius even when using the squeaky-clean California power mix:
How to interpret the above: the leftmost magenta square is a 0-EV-only-mile range gasoline-electric hybrid: a Prius, essentially. The rightmost magenta square is a PHEV 40: a Chevy Volt, more or less. The rightmost grey square with the dotted red circle around it is a pure BEV, a 150-mile range Nissan Leaf, if you will. Note that the slope of the magenta line across the various PHEV ranges is basically null: in other words in combined use the Volt has only a negligible reduction in well-to-wheels GHG emissions when compared to a Prius. Also note that the well-to-wheels GHG emissions of a pure BEV like the Leaf-on-steroids is about half that of either the Volt or the Prius.
VI. Conclusions
I'd say the results of this study are a pretty clear "win" for BEVs, and a pretty clear failure for the case of PHEVs. In the best case of California clean power generation and charge-depleting use in the first 40 miles of its range the 2015-spec Volt is as clean as a BEV in terms of well-to-wheels GHG emissions. In every other case (outside 40 miles of range, power less clean than that of California) the 2015-spec Prius at least matches the Volt and in some cases even beats it outright.
Given my interpretation I find it curious that the authors instead conclude that PHEVs can lead to reduced GHG emissions and energy usage… when compared to conventional gasoline vehicles. I find this conclusion of theirs disingenuous, as when comparing (rightly, in my opinion) to non-plugin gasoline electric hybrids like the Toyota Prius then one sees that the environmental case for PHEVs basically falls flat on its face. I can only speculate why the authors didn't emphasize this point more.