Prius NHW10 (MK1) Hybrids - How to test and resurrect them

Mr. Mik said:
...
...

Another (hopefully good!) result is that the master warning triangle and the Car with exclamation mark come on when the car is turned on with the charger attached and powered up. I expect this to disappear as soon as the PTC strip is reconnected to the stock system. If the warning symbol remains on, then this is of course a bad outcome. I will know in a few hours. ...
...

The warning triangle and car with exclamation mark disappeared after three times turning the system on and off, without starting the ICE. I read somewhere that many error codes get cleared automatically if the fault does not recur during the next three drives.

So the unexpected safety-charger-shut-off and warning signal on dash when the car is turned on during EQ charging has had no deleterious effect at all. Nice! :D
 
Attached is a PDF with photos of a individual cell replacement by soldering the cell in.

Here is what the person who sent it to me explained about the process:

You have my permission to publish them.

To avoid overheating of the cell you need a quick soldering. This is done easily using a strong soldering iron and soldering flux which is formulated to remove a film of oxides from the metal and make the solder and metal more able to dissolve in each other flux.


The current capability its ok but I don’t know if the internal resistance of the cell is suitable.

As I already mentioned I make the same cell replacement during 2007 and until now the modified module is working ok except of course from the continuously displaying in the centre display the "exclamation mark" within a triangle below the battery sign.
From the scanner I see that the repairing module has a little more voltage from
the other ones which is not affect the car operation.

The scanner is a Carman scanner.
 

Attachments

  • Prius single cell replace jun10.pdf
    763.9 KB · Views: 916
Here is how I measure the voltage and current during discharge of a complete NHW10 battery pack using a PoScope.
http://www.poscope.com/ (The basic kits do not contain the x100 probe which is needed for this setup!)

Do not attempt this if you do not have the necessary skills and experience! The voltages and currents involved are lethal and there is also substantial risk of causing a fire!


I do not yet know if a single reversing cell is detectable with this setup. But when I measure a NHW10 half-pack or a Vectrix 102s NiMH battery with a similar setup to the one shown, then I can easily spot an empty cell if it occurs during the flat part of the discharge curve. A single cell hitting empty is not obvious if / when it happens during the "Knee" in the discharge curve for the whole battery.

The discharged Ah capacity could be calculated by using a spreadsheet program and feeding the CSV log from the PoScope into it. I'll have to try that one day...

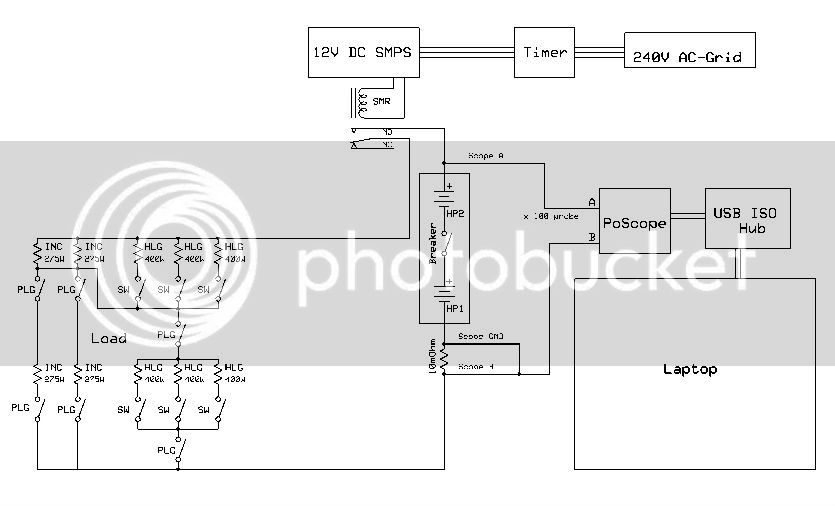
Click thumbnail for larger schematic:

Dischargemonitor25-2.jpg


Description:

The simple plug-in timer is used to automatically terminate the discharge, just in case I get distracted. I set the timer for a time that is too short to discharge the battery completely. The timer has an override switch, so that - if I am there to observe - the discharge can continue uninterrupted. If I am not there, it stops at a safe time.

The timer supplies power to a 12V DC switchmode power supply (SMPS), which keeps a System Main Relay (SMR) closed as long as the timer provides power. I use an SMR which I removed from another NHW10 battery, but it should also be possible to use one of the SMR's of the NHW10 battery which is being tested!

The two battery half-packs (HP1 + HP2) are separated by the mid-pack circuit breaker. The breaker is the last part to be connected, and the first to be disconnected. When the breaker is out, the battery is relatively speaking much safer. When the breaker is in, it is very dangerous.

On the negative output of the battery I connect a 10mOhm shunt.

Channel B of the oscilloscope measures the voltage drop across that shunt, i.e. 10mV/A.
The ground lead of the PoScope is connected to the battery side of the shunt and is also the reference for Channel A.

Channel A has a 100x probe connected, because the battery voltage far exceeds the maximum allowed voltage of the PoScope.

The load consists of pairs of resistive loads. I modified a power board so that its outputs are in series instead of in parallel. This is needed because the loads are rated for 220-240VAC, so they would not last long on 320VDC. It is however important to always have similar loads in series, or the weaker resistor will experience a much higher voltage and possibly burn.
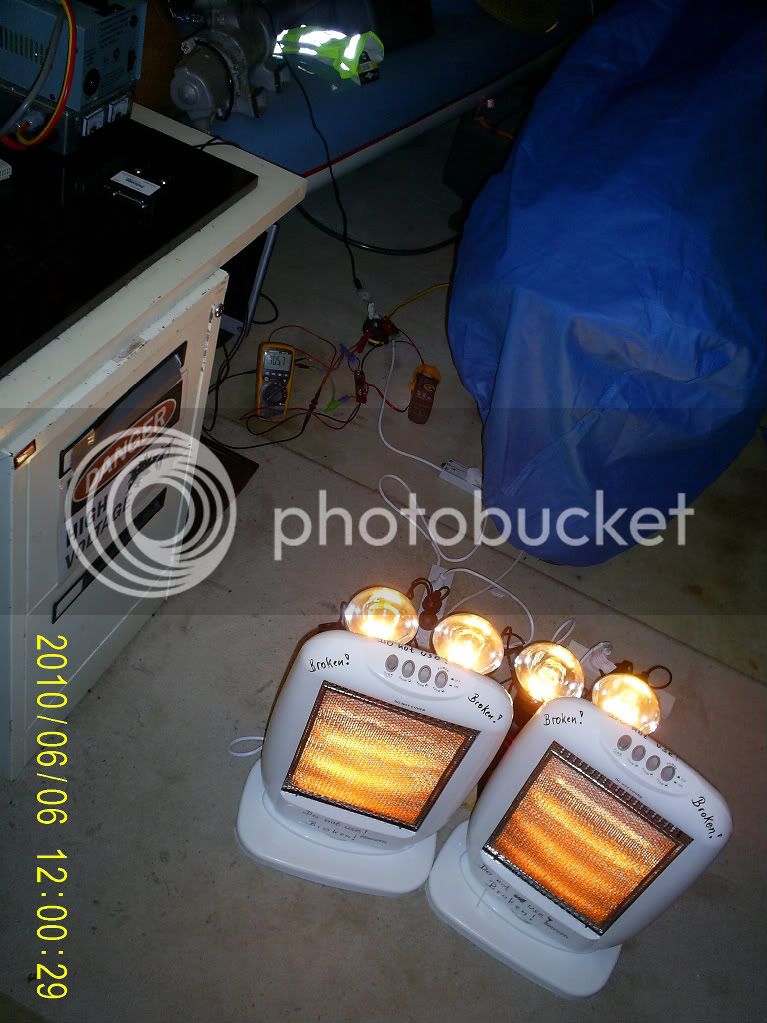
Two halogen heaters with three individually switch-able 400W rated modules (HLG) make up the bulk load.
The switches on the halogen heaters are not capable of disconnecting DC currents! They arc and weld together. Turning it off is the job of the SMR!

A few lamps with inter-changeable incandescent globes (INC) serve to fine-tune the load as needed to achieve more or less current.
With all the loads switched on, about 6A will flow at the start of the discharge of a full NHW10 battery.

Between the PoScope and the laptop (running the PoScope software) is a galvanically isolated USB hub, just to prevent any dramas with ground loops or other rogue electrons frying my computer and data! :!:


The Halogen Heater Array (HaloHA) looks like this:
S4026040-1.jpg


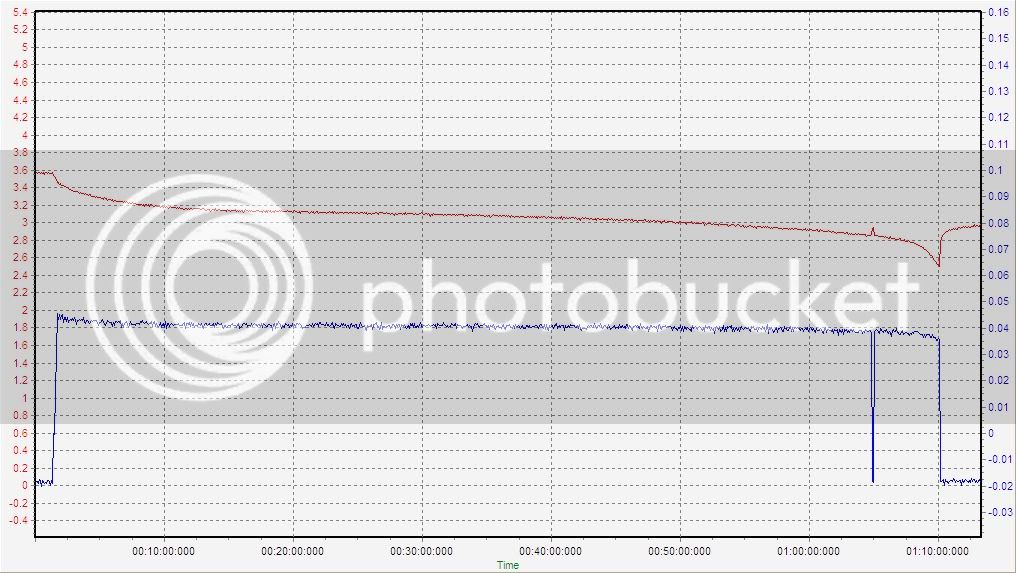
I have not been able to calibrate the PoScope in recorder function so that it displays accurate voltage for the battery or accurate current draw! For a NHW10 half-pack the measurements are OK, but for a full pack the voltage reads around 10V too high, and the current reads 2A too low.
This is not too important though, because the really important information is in the shape of the curve, rather than in it's level!

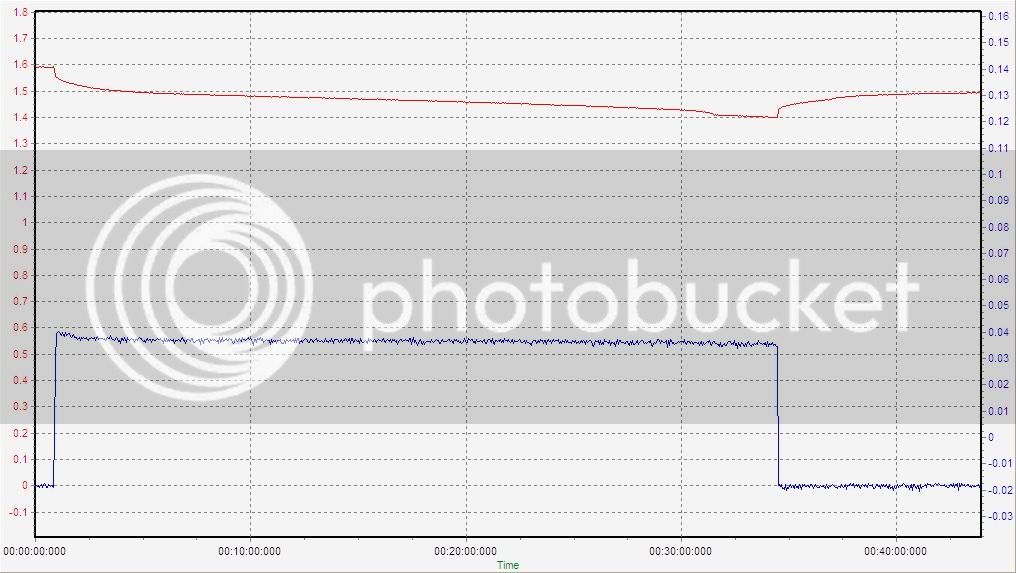
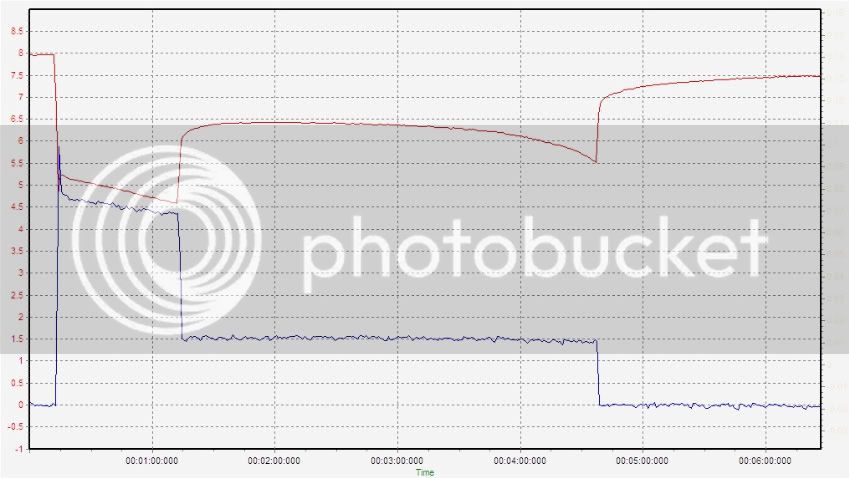
This graph shows a 6A (at start) discharge of a complete NHW10 battery (including the interruption by the safety timer):
NHW10-03DC6A2010-06-06overview.jpg

The cells are either balanced, or the drop from a single cell hitting empty is too small to see.


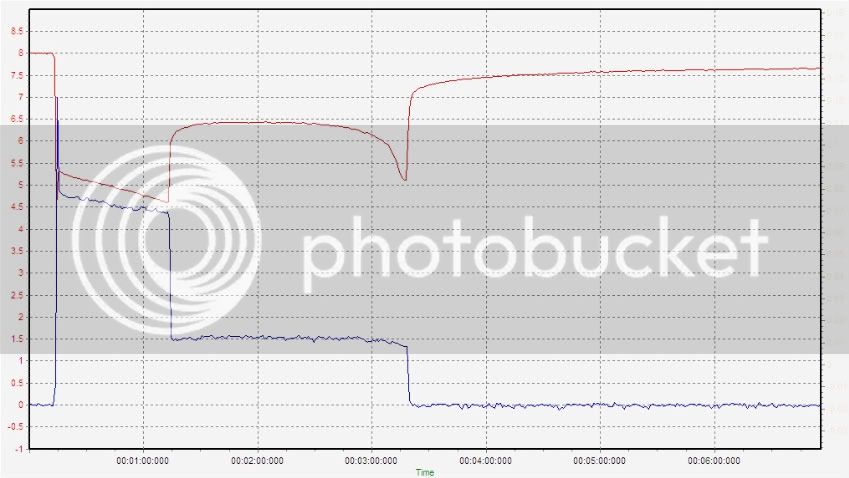
This graph shows a 6A discharge of a NHW10 half-pack with a single cell dropping to zero V:
NHW10-02HP1DC6A1doverview.jpg
 
EDIT 2010-07-07: This method is not my favourite any more....


I finally got the idea (and the experience) to put all my various pieces of equipment to work together for a "fast" :lol: and thorough NHW10 test method.

Core point: Replace capacity testing with the CBAIII with capacity testing with the AMPEASEL and PoScope monitor.
http://endless-sphere.com/forums/viewtopic.php?f=14&t=12032
This allows a high current test to be performed at the same time as the capacity test, but it is much faster, and also produces a graph (I like that because it is easier to understand a graph than the raw numbers, at least for me).

I also use the Special Freddy (SFreddy) charger and the Halogen Heater Array (HaloHA) in the process.

Step 1): Charge entire NHW10 battery with SFreddy to about 150% capacity.

Step 2): Discharge through HaloHA with PoScope monitoring and safety timer.

Steps 3 to 8 ): Repeat 1) and 2) three times, but less over-charging is needed, 120% is probably OK (12 hrs with SFreddy)

Step 9): Charge with SFreddy and leave to rest for 2 weeks to allow self-discharge to occur.

Step 10): Take half-packs out of the battery at some time during the self-discharge period.

Step 11): Test individual sticks ( while they remain in the HP's) with the AMPEASEL and PoScope monitor.

The whole process will take 20 days, but reduces the time that needs to be spent 1:1 with the equipment.

If you work full time with these batteries, then there might be better ways of doing it; but if you have a day job and other things to do, then this approach might be the most efficient one. It's certainly the best I've been able to come up with, so far.

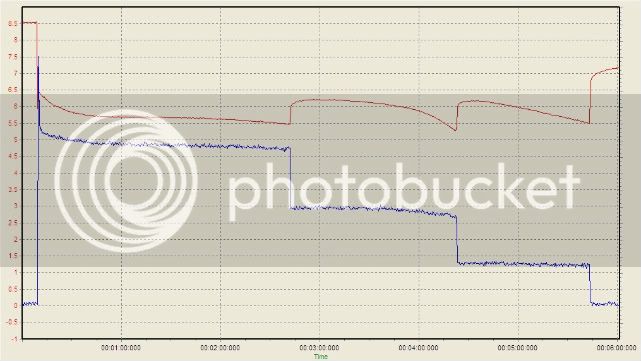
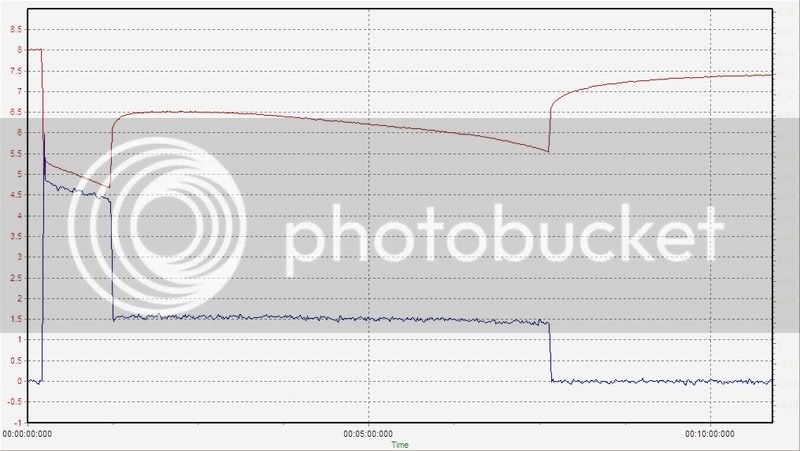
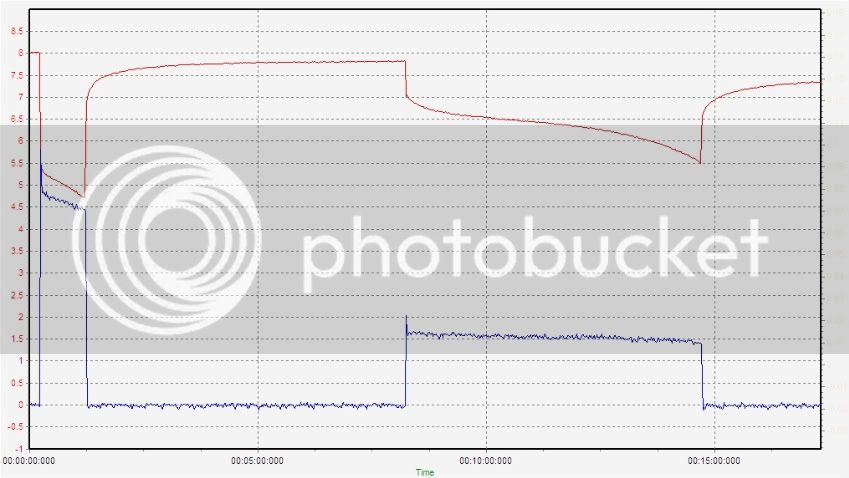
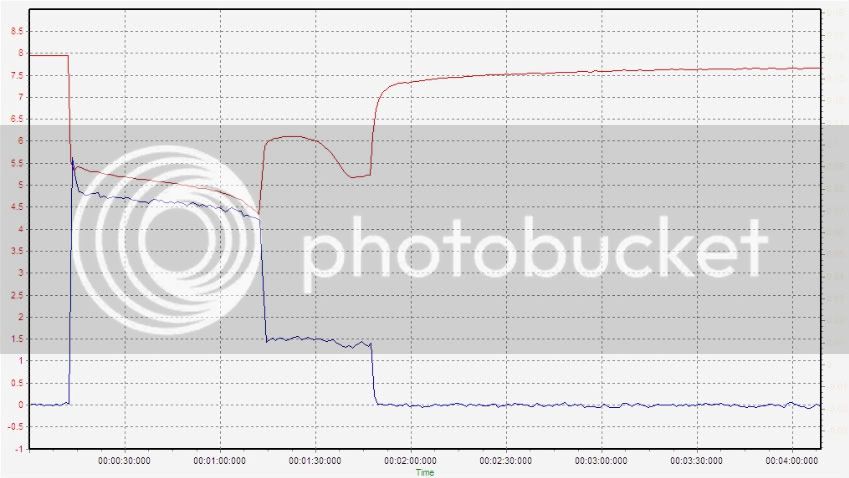
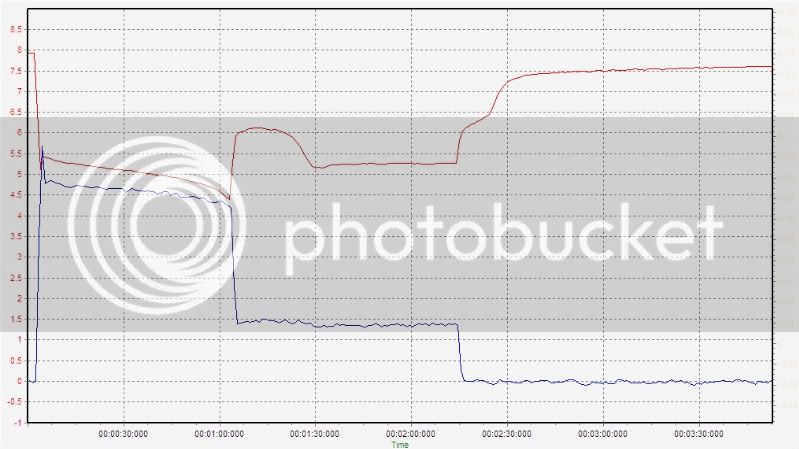
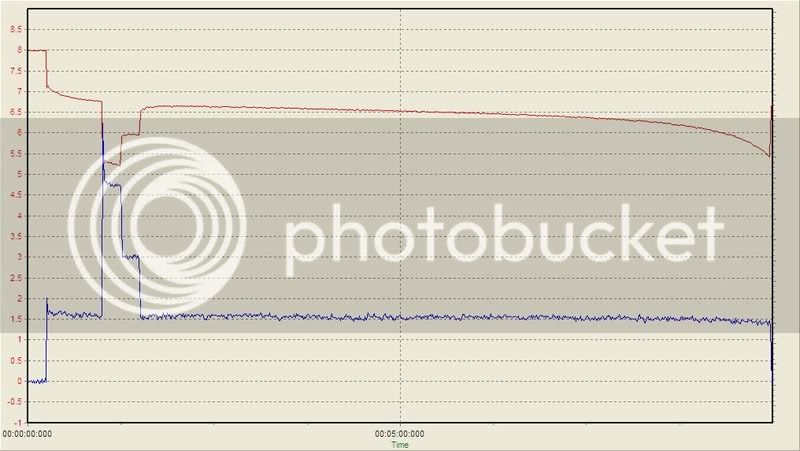
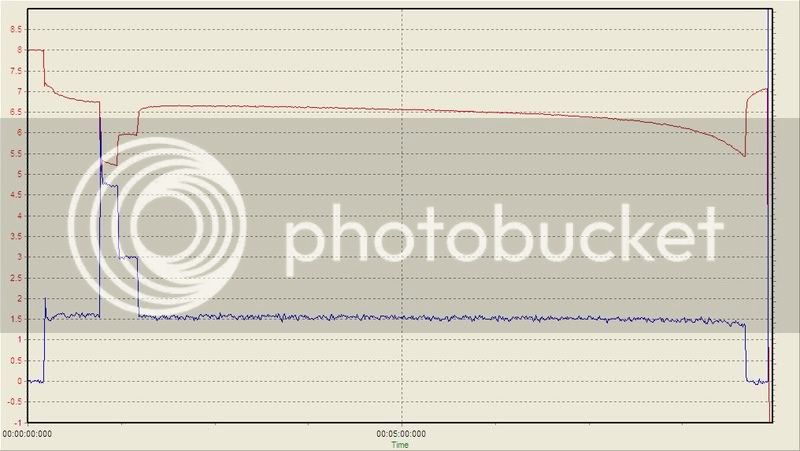
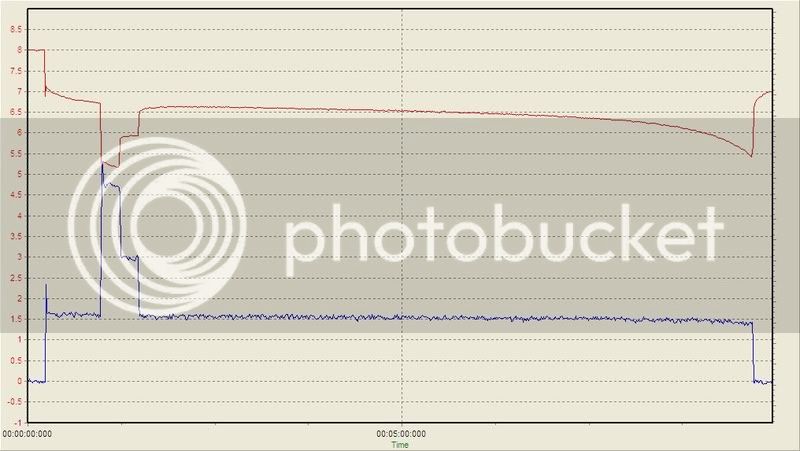
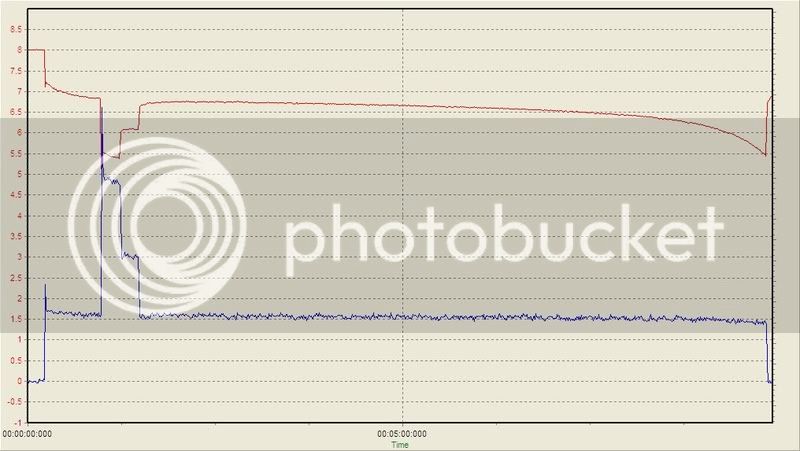
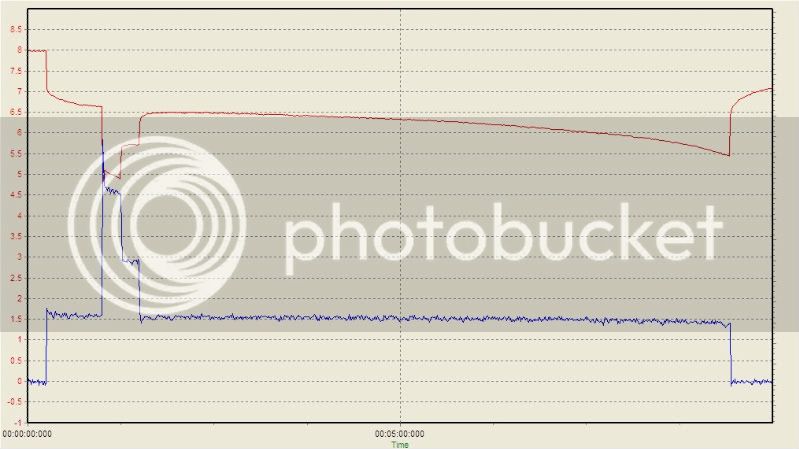
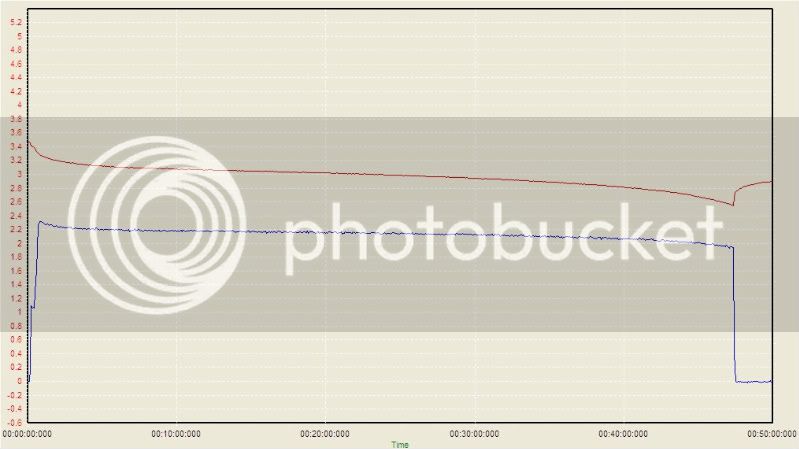
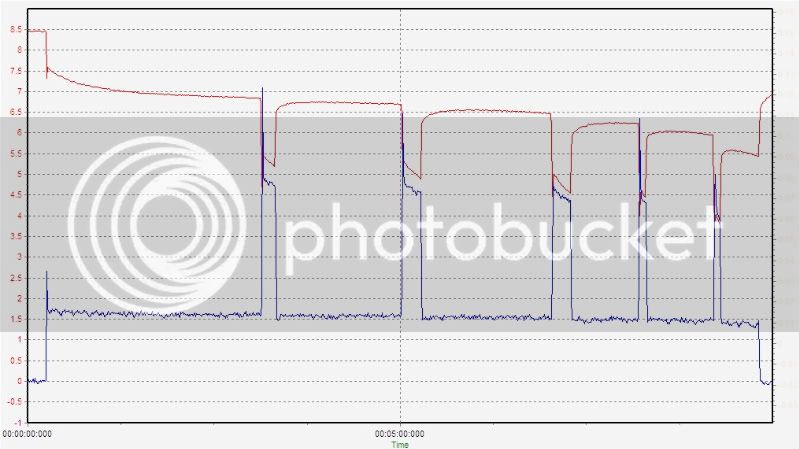
The AMPEASEL test (Step 11) discharges the stick in one session at 100A, then 60A, then 25A (all approximate current), and each time to a cutoff voltage of 5.5V. It needs to be done closely supervised, see below graph for my blunder with being a littler inattentive - the cutoff voltage between step 2 and 3 is too low because I did not flick the switch in time!

Red curve: Stick voltage in V.
Blue curve: Current x 20 in A.
X-axis: Minutes
NHW10-NFGHP1S05AMPEASEL2-1.jpg


The sticks do get hot during this test, I've seen 70degC so far. Measuring the resistance of the temp sensor strip along the stick might be an additional way of gaining data about the stick, I'll try that when I get around to test the sticks in the HP's . So far, I have only tested this with sticks outside of the HP's.
 
Although it might be a minimal effect to the cells in the end and might not matter much to you but pulling a 100 amp load and continuing with a large load is going way out of spec and possibly damaging these cells in ways that might not be immediately apparent.

The Honda Insight will pull 100amps but it won't do it for minutes at a time, it does it for about 10-15 seconds based on conditions such as battery state of charge and won't even do a full 100 amps unless the temperature is low enough.

The Panasonic HHR650D cell maximum continuous discharge specification is 32.5 amps (5 times their test discharge Ah rating)

I like to keep them under 50 degrees as much as I can and if I were doing the levels of current you are I'd be doing everything I can to keep them cool or at least a decent box fan, if not a blower aimed at them on full speed. I've pulled these cells off of a charge at 50 degrees and watched them climb over the next 10 minutes to 55 degrees. They are hotter inside than they are on the outside, especially with added cooling so keep in mind they might be 70 degrees right after the discharge but what were they 10 minutes later? Have you checked?

I don't think waiting 10-15 minutes is a long time to discharge a stick in the 30 or less amp area, but you've likely got different priorities.
My 2 cents, take them for what you feel they are worth.
 
MN Driver said:
Although it might be a minimal effect to the cells in the end and might not matter much to you but pulling a 100 amp load and continuing with a large load is going way out of spec and possibly damaging these cells in ways that might not be immediately apparent.

The Honda Insight will pull 100amps but it won't do it for minutes at a time, it does it for about 10-15 seconds based on conditions such as battery state of charge and won't even do a full 100 amps unless the temperature is low enough.

The Panasonic HHR650D cell maximum continuous discharge specification is 32.5 amps (5 times their test discharge Ah rating)

I like to keep them under 50 degrees as much as I can and if I were doing the levels of current you are I'd be doing everything I can to keep them cool or at least a decent box fan, if not a blower aimed at them on full speed. I've pulled these cells off of a charge at 50 degrees and watched them climb over the next 10 minutes to 55 degrees. They are hotter inside than they are on the outside, especially with added cooling so keep in mind they might be 70 degrees right after the discharge but what were they 10 minutes later? Have you checked?

I don't think waiting 10-15 minutes is a long time to discharge a stick in the 30 or less amp area, but you've likely got different priorities.
My 2 cents, take them for what you feel they are worth.
Excellent points, thank you!

So far I have only done this a few times to two sticks, a good one and a bad one with high self discharge rate.

I have already been pondering something similar to what you said overnight, and woke up with a new plan brewing in the back of my head:

1) Discharge at 100A for a brief time - until the curve goes somewhat flat, or the voltage drops too far, or a certain time has elapsed. Basically do it long enough to seeee if the voltage collapses under the load or if it holds.

2) Switch to about 50A (I'll adjust the AMPEASEL) when any of the termination points have been reached in above point 1). Then switch to step 3) when the peak in voltage has just passed. (You can see in the discharge graph that the voltage recovers from the 100A discharge for about 20s before beginning to fall again).

3) Discharge at about 32.5A (I'll adjust the AMPEASEL accordingly) until 5.5V cutoff is reached.

It will take slightly longer, but not much. It will still incorporate the 100A test, but limit the heating. The drop from 100A to 50A should make the peak more pronounced and give a clear indication for when to switch to 32A. I would like it to be "repeatable" so I can compare results and reliably identify bad sticks. Maybe I'll get rid of the 50A stage altogether, need to experiment a bit more.

Re: the heating after charging and discharging: There are several factors at play:

A) The cells do not necessarily heat evenly, sometimes there are hot spots. If you measure a cool spot, you get more temp rise after the test. If you measure at a hot spot, you get temperature drop soon after the end of the discharge.
B) The absolute temperature of the cells. Above some point the heat transfer to the environment is so high that the temperature falls soon after the end of discharge. At 60-70degC the temperature seems to peak within 2-3min after discharge or earlier, then falls rapidly.
C) Charge or discharge - after charging the temperature rises for much longer than after discharging.
 
Here is the version I arrived at at the workbench:

Click to enlarge.

NHW10-NFGHP1S05AMPEASELII1-1.jpg


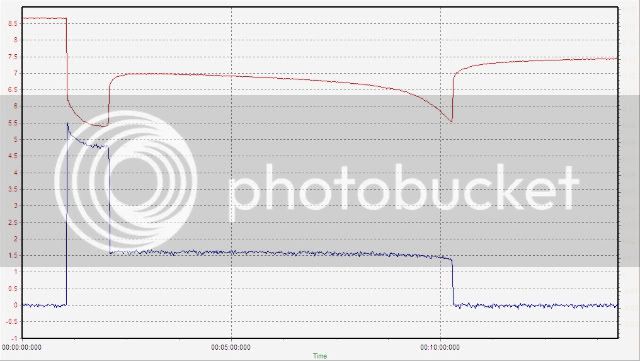
100A for 1 minute, followed by 32A until 5.5V cutoff.

Temperature stays below 50degC (only just, when starting belo0w 30degC and in ambient temp of 18degC) and temp opeaks at 1min after end of discharge.

The testing of two half-packs can be done in a single weekend day at this rate. With the CBAIII it would take an entire weekend.

Later today I will tackle a HP in this (or a similar) manner.

Of course, it might turn out that after 2 weeks of self-discharging I need to change the approach - the above tests were done straight after charging!

Detailed temperatures (by IR thermometer):

Max cell temp at time (DegC):
0 min: 21.8 = Stick temperature before test.
1min: 34.0 = Stick temp after 100A test:
2min: 35.1
3min: 36.4
4min: 37.8
5 min: 39.2
6min: 40.8
7min: 41.9
8min: 43.5
9min: 45.4
Turned off.
10min: 47.3
11min: 46.4
12min: 46.4
13min: 45.8
 
Here are the results of the first Half-pack (HP) of battery NHW10-02 tested with the Ampeasel.

General AMPEASEL test procedure:
Reduce current or terminate test at any time if the curve looks like the stick is not coping
1) Turn on recorder (PoScope)
2) Start at full load, ~ 100A
3) Switch to ~30A after 1min of discharging.
4) Switch off when 5.5V cutoff voltage is reached.
5) Measure resistance of Temp Sensor Strips with max recording for each stick (results not shown, they were very unspectacular! The best sticks show a rise from 1 Ohm to 1.8 or 2.0 Ohm; poor sticks show no rise because less energy is dispensed in the discharge)
6) Wait for the voltage to rebound and flatten out (some of the most interesting details can be in that part of the curve!)

This battery had been removed from a Prius 1-2 years before I got it (about a year ago). It was "charged up" occasionally with the booster charger included in the NHW10 Prius (by the previous owner). As far as I know, this does not fully charge the battery, only brings it up to enough SOC to kick the ICE over. I let it sit for 6months or so, uncharged.
In mid December 2009 I opened the battery up and measured voltages:
Entire open : 273.3V
HP1 open: 134.8V
HP2 open: 138.4V

I charged the battery very slowly (5 days) just once (using Universal Freddy, a charger similar to Special Freddy, but it has 4 different switch-able motor run capacitors to make current adjustable).
This was in preparation for buying my first Prius NHW10 (the blue one) off ebay. I won it, dropped the battery into the car and drove it until early March 2010 without apparent problems. The warning triangle was permanently on - it stays on even if the battery is perfectly good. It can only be reset with a Toyota S2000 scan tool.
Then, in early March I got some indications that the car was trying to charge the battery by revving the ICE slightly higher than usually, and then a single "turtle" (a turtle shaped LED on the dash, meaning "Go Slow" or something like that).
I repeated the EQ charge, this time in the car and over 2 days, which fixed it all back to working well. Another week later I repeated the EQ charge to test the wiring harness I had installed by then, adding in a variac to boost the voltage. It all worked well.
I drove the blue Prius for another week or so (without any apparent problems), and then I parked it in the sun for about 3 to 4 weeks. The first week or so without a cover, the last two weeks with a white car cover. All of this in Australian Summer heat conditions.... I had just bought another two NHW10 Prii and was busy with them, and with analysing and repairing the battery that had come with the blue car, the one I called "Dead as a Dodo?? Dying Swan or Phoenix?" battery mentioned above. Once I had restored the original battery by replacing a single bad stick in it, I put it back into the blue car; no more warning triangle since then (due to the original B-ECU installed with it - it does not have the warning triangle stored!).

It was on April 24th that I removed the NHW10-02 battery from the blue car and started a stick-level capacity test on April 26th, named the CBAIII Test 1 below; done at 12A to 5.4V cutoff level.
The results were all over the place! They do not correlate with the later test results, except for the worst stick of them all - that one was bad in all three tests (but only HP1 finished testing so far).

Then I charged both HP's once on the bench and let them sit for three weeks, before the CBAIII Test 2 (also at 12A to 5.4V cutoff).

Because the results were so different from the first test, I cycled the HP's 5 times on the bench (whilst improving the method for detecting a single reversing cell) and then let HP1 sit for 2 weeks in the cool garage to self-discharge. HP2 is up for the Ampeasel test next, in a few days time when it has also rested 2 weeks.

The results of the first CBAIII capacity test (after 3-4 weeks of standing in the car in the heat) are given below together with the results of the second self-discharge test with the CBA III and with the graph showing the result of the third (Ampeasel) self-discharge test done yesterday. This helps to show if the high current Ampeasel test is actually helping, and if the 5 x cycling has helped!


Red curve: Voltage in V
Blue curve: Current in A x 20
X-axis: time in h:min:sec:msec

The sticks were not tested in the Ampeasel test in the order shown below. Instead, I started at the top of the pack to reduce the heating up of untested sticks from the discharging sticks below them.

Stick 1 = negative end of the pack.
Stick 20 = positive end of the pack.

Stick 01:
CBAIII test 1: 1.956Ah; good curve.
CBAIII test 2: 4.642Ah, good curve
AMPEASEL test: A good one:
S012wk100A.jpg


.
.
Stick 02:
CBAIII test 1: 1.876Ah, good curve.
CBAIII test 2: 4.519Ah, good curve.
AMPEASEL test: Another good one ( I forgot to turn the PoScope monitor off before disconnecting the cables)
S022wk100A.jpg


.
.

S03:
CBAIII test 1: 0.960Ah; good curve. (That's one of the inconsistent ones!)
CBAIII test 2: 4.064Ah, good curve.
AMPEASEL test: Another good one:
S032wk100A.jpg


.
.

S04:
CBAIII test 1: 1.214Ah, good curve.
CBAIII test 2: 4.088Ah, good curve.
AMPEASEL test: I stuffed up! Instead of turning to 30A at 1min, I turned it off! But a good stick, nevertheless.
S042wk100A.jpg


.
.
S05:
CBAIII test 1: 1.021Ah, good curve.
CBAIII test 2: 4.084Ah, good curve.
AMPEASEL test: Another good one.
S052wk100A.jpg


.
.

S06:
CBAIII test 1: 1.194Ah, good curve. (One of the inconsistent ones)
CBAIII test 2: 0.105Ah, early drop, bad cell? Stopped manually.
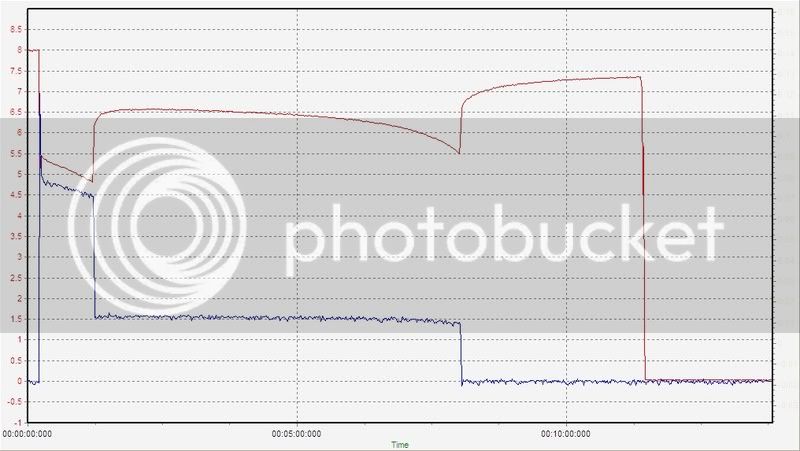
AMPEASEL test: A very very marginal stick! Note the steep drop towards the end of the 1min @ 100A phase. It recovers briefly, but the weak cell in the pack empties after a brief time at 30A. Because I terminated the discharge very soon after the obvious end of the fall in voltage at 1min:40sec (= a single cell has finished falling to zero V), there was a smooth immediate rebound in the overall stick voltage. The cell which dropped to zero volt bounced back up to around 1.1V immediately.
S062wk100A.jpg


.
.

S07:
CBAIII test 1: 1.104Ah, good curve. (inconsistent with the two others)
CBAIII test 2: 0.02Ah, very early drop, terminated manually. Bad cell!
AMPEASEL test: Similar to S06: It just manages to hang on for 1min @ 100A, with a steep drop at the end. Then, early in the 30A phase, a single cell in the stick drops to 0V. But this time, I let this continue for about 45sec. The result of this 45sec reverse charging event (is it that, strictly speaking?) is the kink in the recovery curve after the end of the discharge, at about 2min:25sec. The sudden rise by about 1V is caused by the recovery of the weak cell from around 0V to around 1V. The longer it was reverse charged, the longer it will take to bounce back up. If it was for too long, it would never bounce back!
NHW10-02HP1S072wkSDCAMPEASEL2010-06.jpg


.
.

S08:
CBAIII test 1: 1.805Ah, good curve.
CBAIII test 2: 0.072Ah, good curve.
AMPEASEL test: I stuffed up the recording...forgot to save it! Cell reversal during 100A. Did not recover when switched to 30A at about 40sec; delayed voltage recovery of single cell after turning off (like with stick 07); Switched off early due to cell reversal.

.
.
S09:

CBAIII test 1: 1.588Ah, good curve.
CBAIII test 2: 2.183Ah, good curve.
AMPEASEL test: A good stick, but clearly less capacity than the best ones.
S092wk100A.jpg


.
.

S10:
CBAIII test 1: 1.782Ah, good curve.
CBAIII test 2: 1.195Ah, good curve.
AMPEASEL test: A marginal stick. Copes OK with the 100A phase, but the 30A phase is only abot 2minutes long. After the discharge, it recovers to over 7.7V! This is due to the majority of cell in the stick still not being anywhere near empty. Just one cell hit empty (t 3min:20sec), and once it bounces back up to 1V, the remaining charge in the other 5 cells brings the resting voltage up higher than it would be for a good stick which has been able to discharge most of it's energy.
S102wk100A.jpg


.
.
That will have to do for this post, the forum software will not allow more than 10 pictures per post!
 
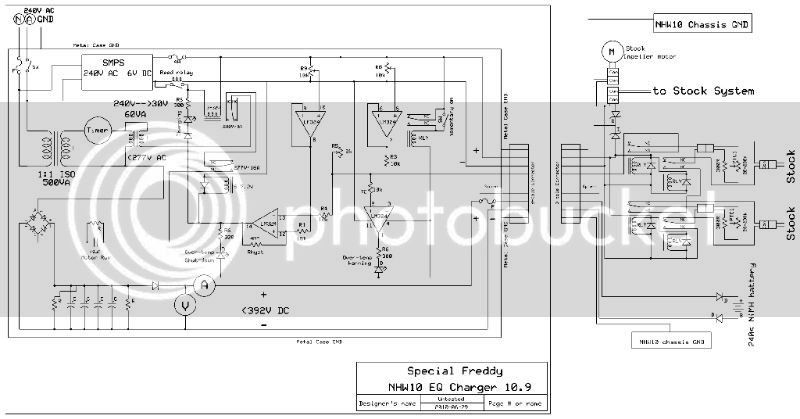
I'm working on an improvement to the Special Freddy charger.

My first Op-amp project, thanks to help and inspiration received from Mike Dabrowsky here: http://www.insightcentral.net/forums/167918-post534.html

By adding a LM324N and a number of LED's the over-temp shutdown should get much more reliable than the relay method I used so far and give an easily visible indication of what is going on. I plan to install the LED's so that they illuminate the voltmeter and ammeter during operation.

The LM324 is used s a voltage comparator and switches it's output high or low with trigger-like accuracy, unlike the drop-out voltage in my previous design.

I should be able to set a warning temperature of, say 40degC, and a cutoff temperature of 45degC with good accuracy. The previous design was only able to shut down the charge current with severe battery over heating. The new design should also resume charging once the temperature falls to the set levels again!
The diagram below is still full of errors!
Click to enlarge.

SpecialFreddyNHW10EQcharger109-1.jpg
 
I have now tested the individual sticks in the battery I call NHW10-03, mentioned in the post https://www.endless-sphere.com/forums/viewtopic.php?f=14&t=12764&p=280873#p279315 above.

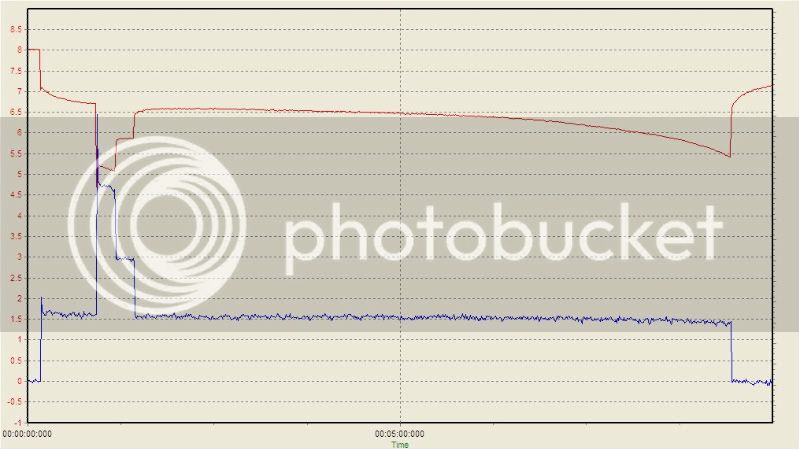
This graph shows a 6A (at start) discharge of a complete NHW10 battery (including the interruption by the safety timer):
NHW10-03DC6A2010-06-06overview.jpg

The cells are either balanced, or the drop from a single cell hitting empty is too small to see.

The results of the individual stick tests (below) show that the sticks are nicely balanced with regard to their capacity under a 30A / 100A / 60A / 30A discharge.

I am quite certain that also translates into very similar capacities at the 6A discharge applied (above) earlier to the whole battery.

So I still don't know if a single cell in the 240s battery can be spotted dropping to zero V on the PoScope graph! But I have another good battery......or do I?

That is my question here: Should I replace the sticks with greater voltage drop under load, although they are not much different from the great majority of sticks in the pack with regard to Ah capacity?


Please have a look at the discharge graphs below and let me know what you think: Should I take the 3 or 5 weakest sticks out?

The pre-test preparation of the NHW10-03 battery:

A) 4 complete charge (@~0.6A) and discharge (@ ~ 6A) cycles
B) Another complete charge @ ~0.6A
C) 2 weeks rest for allowing self-discharge to occur (@ ~ 17degC on garage floor).


The AMPEASEL III test applied to each individual stick while remaining in the half-pack (quoted below are my own prompts for note taking and procedure during the test):
AMPEASEL III Stick Nr:
Ambient temperature (degC):
Set AMPEASEL to 30A.
Start timer and PoScope together. Wait 15sec.
Start AMPEASEL at 30A load. Cutoff level: 5.5V
At 1min switch to 100A for 15s, then back to 60A. Cutoff level for 100A test: 4.2V
Discharge at 60A for 15sec. At 1:30 switch to 30A. Cutoff voltage for 60A test: 5.0V
Stop discharge at 5.5V cutoff level.
Continue logging to recovery of all cells.
Turn off at 10:00
Total time (min:sec):

Following this procedure I get a set of very comparable graphs. I have not figured out how to overlay them into one picture, but viewing them with a picture viewer program sequentially shows the differences very nicely.

Here is a group of very good stick test AMPEaSEL III results from the first half-pack of this battery - no poor cells in there at all:

(Red curve = Volt; Blue curve = Ampere x 20)
Stick 1:
AMPEASELIIIS01.jpg


Stick 02:
AMPEASELIIIS02.jpg


Stick03:
AMPEASELIIIS03.jpg


Stick 04:
AMPEASELIIIS04.jpg


Stick 05:
AMPEASELIIIS05.jpg


Stick 06:
AMPEASELIIIS06.jpg


Stick 07:
AMPEASELIIIS07.jpg


Stick08:
AMPEASELIIIS08.jpg


Stick 09:
AMPEASELIIIS09.jpg


The slightly weaker sticks will be shown in a later post, only 10 are pictures allowed per post.
 
Continuing the individual Stick test AMPEASEL III routine on the NHW10-03 battery:

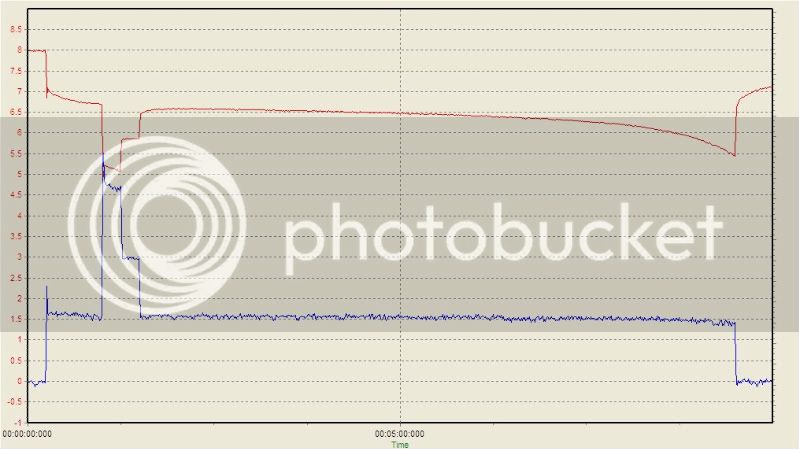
Below are the graphs for the best stick S17 and the worst stick S35:
AMPEASELIIIS17.jpg

AMPEASELIIIS35.jpg

S35 has both the lowest Wh value, highest IR and lowest Ah value, but it does still cope with the AMPEASEL III test, and the Ah capacity is roughly 95% of the Ah capacity of the best stick! It's the worst stick in the pack, but definitely not dead!

Here are the graphs for the other 4 sticks which are slightly weaker than the rest of the pack:

S34:
AMPEASELIIIS34.jpg

S31:
AMPEASELIIIS31.jpg

S30:
AMPEASELIIIS30.jpg

S27:
AMPEASELIIIS27.jpg


The remaining vast majority of sticks are very similar to the good ones shown in the post above, sticks 1 to 9.

My impression is that the best stick is insignificantly better than the bulk of the sticks in this overall good battery, while the worst stick is bordering on being an outlier - but an outlier that is still coping at this stage.

Do you think it is worth the effort to replace the weakest stick(s) out of this battery?

Unless someone has experience showing that this will be a problem, I would tend to leave the battery untouched for now and use it. I might have another look in a year or more, or whenever the battery "plays up" - it should then show if the weak sticks have deteriorated to a more severe degree than the others.
 
I learned something new today: How to use a spreadsheet program (at least a little bit!).

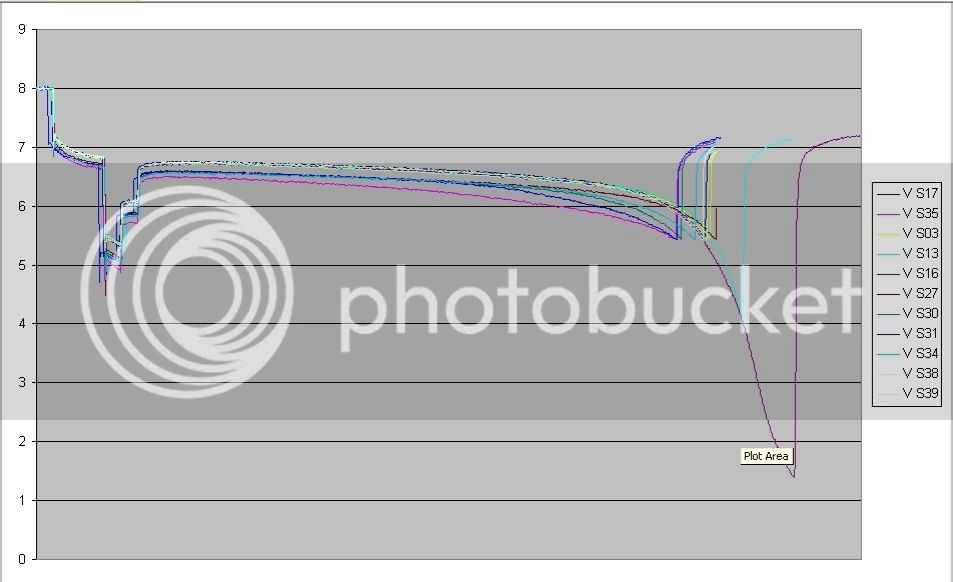
Below is the result, an overlay of the voltage vs time discharge curves of the 6 best and the 5 worst sticks in the NHW10-03 battery. The program cannot handle all 40 sticks.....pffff...

Imagine the remaining 29 good sticks squeezed into the small gap between the groups of 5 and 6 graphs, and you will be able to see that stick S35 is indeed an outlier.

Seeing it like this makes it more tempting to replace S35!

Maybe I'll spend some more time with the spreadsheet program and work out how to calculate the area under the curve, V x I etc to get Ah values and Wh values! But that is really not a priority at the moment.

AMPEASELIIINHW10-036Bestand5Worst.jpg


I'll try to determine exactly how impared the S35 is, by running a "AMPEASEL IV" test procedure on the two worst sticks and two good sticks.

AMPEASEL IV will consist of repeated 100A bursts on top of 30A base load spread across the entire SOC range. See http://www.insightcentral.net/forums/168737-post85.html for more detail.
 
I learned some more spreadsheet basics and this has shifted my final assessment to "replace the worst stick" in NHW10-03.

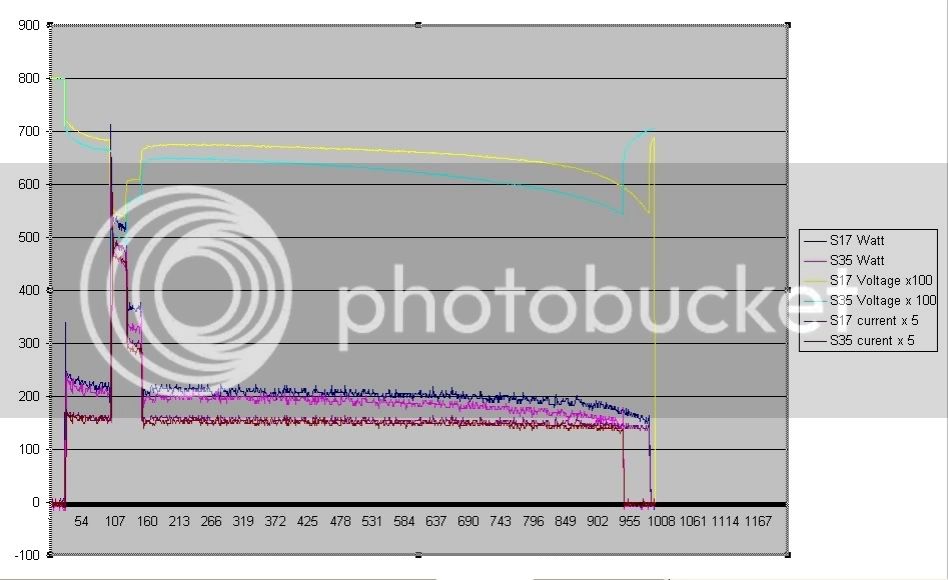
Now I can make graphs showing Amp, Watt, Volt from the same data set gained during the AMPEASEL test.

Here is an overlay: Three ways to compare the same two sticks being discharged:
S1735VIP-1.jpg


I can also use the spreadsheet program to "calibrate" the PoScope data. Unfortunately the PoScope lacks a calibration feature (or I, and the technical support guy, have not found it yet).

For example: (X + 0.018 ) x 1000 gives me calibrated current in amps (with the mV measurements across the shunt as the X value)

I can also add up all the current and voltage measurements every 0.6s - that gives the Wh which have been discharged.

And the ampere/0.6s can be added up to give an accurate Ah value for the discharge (just divide it by 6000).

The result of it all is this:

Stick 35 is significantly worse than the second-worst stick. It is very interesting to look at the Ah and Wh results. The Wh results are more dramatic, because they include both (reduced) capacity and (increased) internal resistance in the result.

If one was using a constant current discharge device, then this might not matter. But with a resistive load these calculations are very important to get the full picture.


After two weeks of self-discharge:

The best stick S17 had 5.34Ah and 34.55Wh.

The worst stick S35 had 4.96Ah ( = 7.1% less than best) and 30.42Wh. (= 11.95% less than best)

The second-worst stick S31 had 5.1Ah (5% less than best)and 31.89 Wh ( =7.7 % less than best).

S 35 had 2.6% less Ah than S31.

S35 had 4.6% less Wh than S31.
And that is what made me change my mind.

Being almost 5% behind the second-worst stick (Wh) is a clear indicator that S35 is indeed an outlier. S35 would in my opinion fail much much earlier than the rest of the pack, if it continued to be used in this pack. S35 will last much longer in pack matched to it's IR.

I have replaced S35 with a stick from another battery, it appears slightly better than the best sticks in NHW10-03 on an AMPEASEL IV test.

The test looks like this:


S35 (weakest stick of the whole battery):
AMPEASELVS35.jpg


S36 (good one):
AMPEASELVS36.jpg


If this test is done after a few weeks for self-discharge testing, it test all the major parameters of battery performance across the whole SOC spectrum.

But, it has not added anything that the earlier AMPEASEL test has told me (the one with 30A-100A-60A-30A sequence). But it requires more operator attention and input.
 
Accidental double posting deleted.
 
I've just posted in the 'wants' section for a stick of the cells these batteries contain...

http://endless-sphere.com/forums/viewtopic.php?f=8&t=19973

Any ideas ?
 
Error Codes which can be read with some scanners (like the Carman Scan Lite and Toyota S2000).


I think I found this in one of the Prius forums.
 
Here are the results from testing the NHW10-06 battery which came with one of the cars I bought. It is an example for a battery that is too damaged to be pampered along with EQ charging.

Initially I just applied a single EQ charge with the battery in the car, but after just 4 days the frequent turtles returned.

A few weeks later I did 5 complete EQ charges and 4 discharge cycles to exercise the battery, also with the battery still in the car.

That had a slightly more lasting effect, but after 10 days the turtles were back, accompanied by frequent Battery Low Point Resets (BaLPoR = sudden drop of displayed battery charge level to low, together with turtle, and followed by charging of the battery to near full display.)

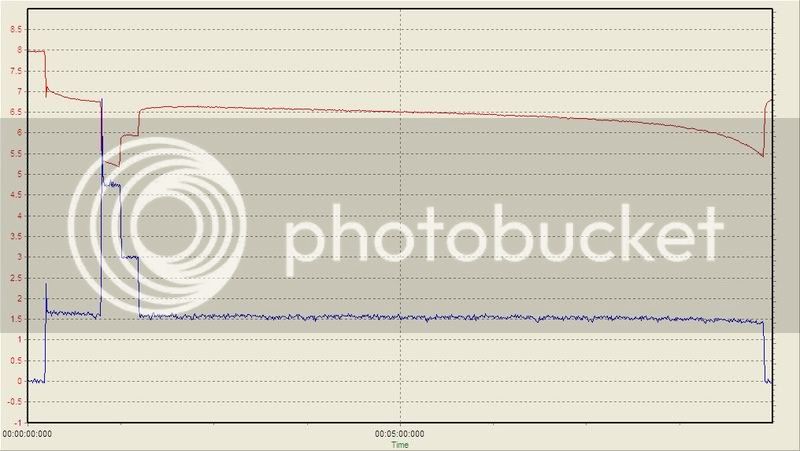
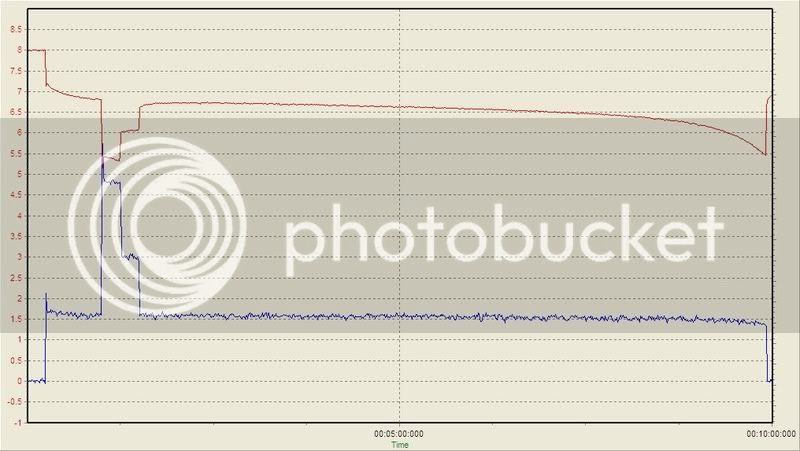
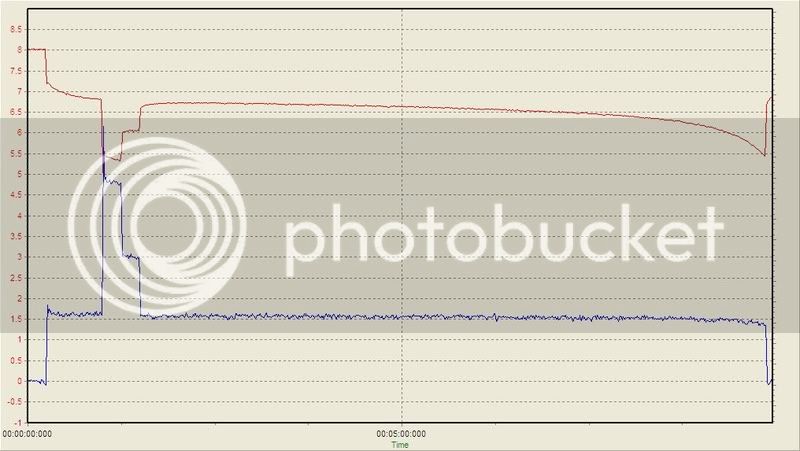
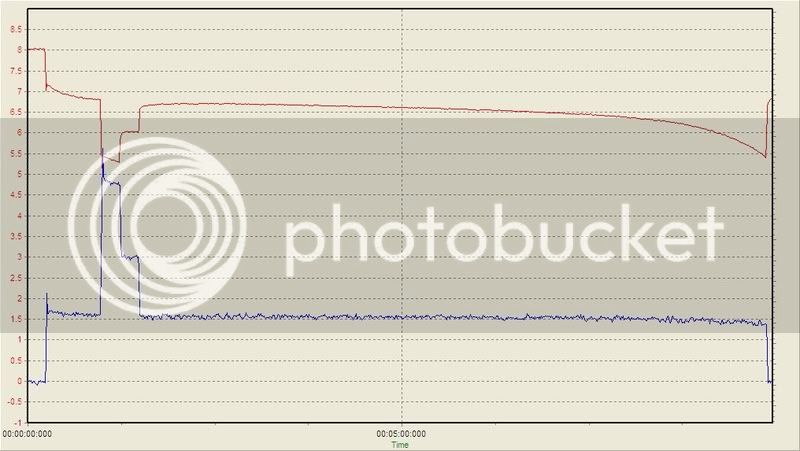
The fourth of the discharges (at about 7A) looked like this:
NHW10-06WhiteCarHaloHA-DC48A2010-06-24-1.jpg

Red: Volts x 100
Blue: Ampere x 3
The first three discharges looked very similar - they were all done just after charging. I still do not know if a single cell dropping to zero Volt would show up in the discharge graph of a 240s string.

After three weeks I removed the battery from the car and gave it an EQ charge in the garage, using the SFreddy charger for 13h:15min. In retrospect, that might have been a bit too short because of the severely increased self-discharge rate of some cells. The cells with the highest self-discharge rate might have been empty at the start of this EQ charge and might not have filled up to 100% SOC. But it does not matter much - the good cells were definitively full and no good sticks would have been misdiagnosed in the following tests.

After two weeks of resting at about 18degC on the garage floor, I removed the half-packs from the battery and tested each stick with the AMPEASEL III procedure.

AMPEASEL III = 45s at 30A-32A; then 15s at ~90A - 100A; then 30A - 32A until 5.5V cutoff.

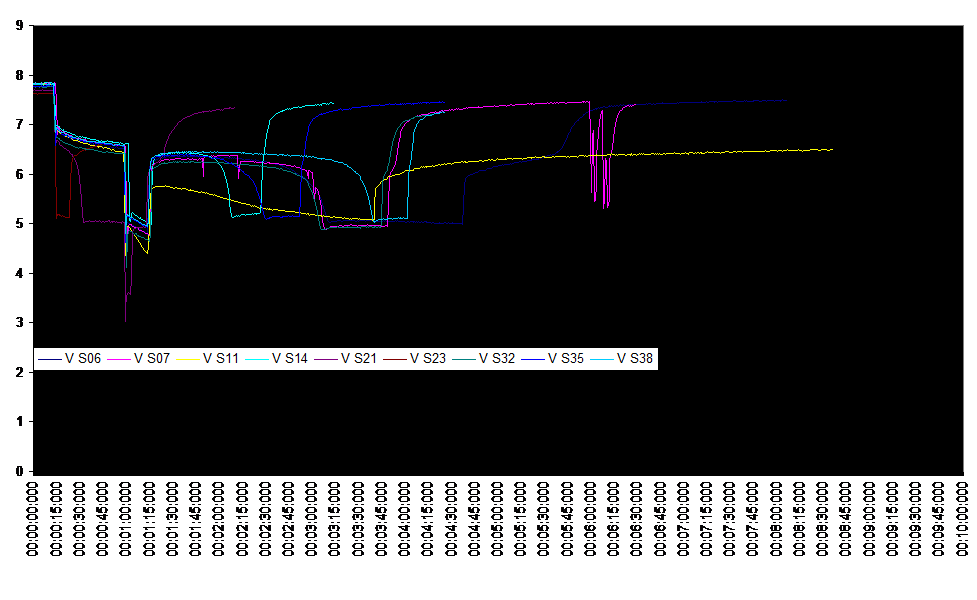
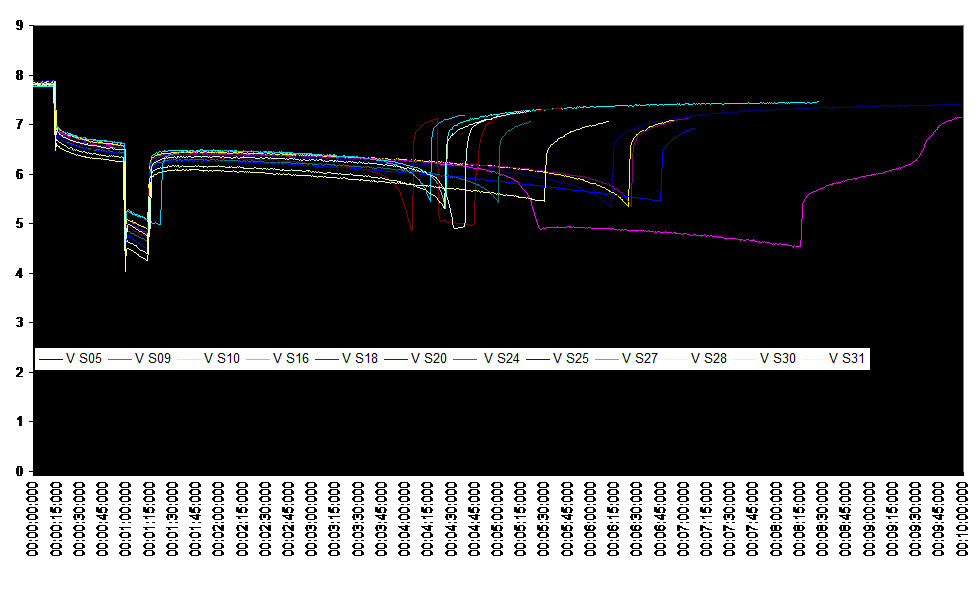
Excel does not seem to be able to handle showing all 40 graphs at once, so I grouped them into three overlays. (I forgot to save the data for Stick 34. It falls into the "Medium" category).

The Worst Sticks out of NHW10-06:

WorstSticks.gif


The Medium Sticks out of NHW10-06:
MediumSticks.gif


The Best Sticks out of NHW10-06:
BestSticks.gif


Now I have some sticks with definite problems and may be able to figure out how they could be detected without lengthy testing!
 
I added a link to nice measurements of the PTC strip performance to the above post https://www.endless-sphere.com/forums/viewtopic.php?f=14&t=12764#p189795

The addition:

Mike Dabrowski has done much more accurate measurements, the results can be seen here (in degF): http://99mpg.com/Data/resources/downloads/relateddocuments/ptctempvsresistance-2.pdf and are explained here: http://www.insightcentral.net/forums/modifications-technical-issues/14496-grid-charger-balancer-59.html#post172411
 
The end plates on one side of each half-pack (HP) have 11 tab wires coming out.

These seem to be fused by 11 built-in fuses. They can stand 3.6A for a few second - but I don't know what their proper specifications are.

The 11 fuses can be seen in this photo:

I'll try to find a better picture later on.
 
The Techno S2000 scanner is the only scanner that can perform all necessary operations on a NHW10 Prius if the NHW10 data disk is inserted into the S2000.

Quite a few S2000, some with the NHW10 data disk, have recently been bought by private NHW10 owners. It seems like Toyota Japan is selling off the S2000, maybe they have a new device to replace them now.

The display of a typical S2000 is in Japanese. This can be a challenge, because the menu structure/content is complex. The S2000 includes DMM and oscilloscope functions as well; try to imagine figuring that out in Japanese....

Well, that's what this post is about. Much of the translation work has already been done, but there is more to be done. Many thanks go to a small group of NHW10 and S2000 owners in England, Australia and New Zealand, who have helped greatly to work out how the S2000 works and how the menus translate.

Some scanners, like the Carman Scan lite, can do most, but not all functions of the S2000, notably excluding the C2579 reset (="Uniform Charge Request").

Attached are two files with incorrect file extensions. For the first one the extension needs to be changed from .pdf to .mmp in order to work (this gets it past the forum software.) It is a "MindMan Personal" file showing the menu structure of the S2000(NHW10) in English.

The other attached file is also misnamed to get it past the forum software: Replace the .pdf with .exe and you will have a working installer program that will install the MindMan Freeware on your computer. This allows you to view the other file, the mindmap showing the English S2000 menu structure.

Newer versions of Mindmanager software are MUCH more sophisticated and capable, but they cost a packet. Using this very old and basic freeware version will allow anyone to contribute to developing the S2000 English map further.

I hope to soon publish a S2000 Menu map which can be viewed with a free viewer software application. It will be much more user-friendly than the MindMan Personal map, but it will not be editable by anyone without the full software version. It's similar to Adobe Acrobat (expensive, creates files) and Adobe Reader (free and read only).
 

Attachments

  • Techno S2000 ENGLISH 1.6 2010-12-20.pdf
    126.4 KB · Views: 244
  • mmpersonal30-2e.pdf
    870.8 KB · Views: 191
Hi everyone,

I have made a more functional Mindmap which can be opened with the free viewer software downloadable from here: http://www.issusa.com/page5753554.aspx

Once you have installed it, you will be able to open the attached Mindmap file and navigate it much more efficiently than the MindMan Personal freeware file. Unfortunately, you will have only "Read" access with the viewer program.

The map can be expanded branch by branch by clicking on the + symbols at the end of branches; or, using ALT&SHIFT&2, ALT&SHIFT&3 all the way to ALT&SHIFT&A(for All), you can open defined levels of depth of the map.

The map also allow inclusion of Kanji and Katakana symbols.

And some PDF files (from the NHW10 Yahoo group) are included for easy reference to what the codes mean.

Text boxes contain additional information or speculation about what some of the menu items might be for/about.

xxxxxxxx means any Japanese symbols, one per x. I used xxx for everything in the beginning, and I think there are parts left where the Katakana symbols are not yet represented by Yyyy's .

xxyyyxxyyyyy means there are Katakana symbols (the yyy's) and others mixed.

Ideally we would include all the Japanese symbols, looking just like the original, but that might not be much of an improvement compared to the effort needed to do it.

For now, this map will give anyone a good headstart with the S2000.

It would be nice if those with Japanese skills or translations could decipher more of the deeper layers of the menu, like the 169 items that can be monitored and recorded from the Battery-ECU.

Please try it out and let me know how it shapes up for people not so used to mindmapping...

The attached file is NOT a PDF file, you need to delete the .pdf at the end of the name and replace it with .mmap for it to work.
 

Attachments

  • S2000 scanner menus 2010-12-21C.pdf
    6.2 MB · Views: 190
Hi, All,
I am new to the site and have only just purchased a '98 Prius that had a dead HV battery. I recharged the battery by first charging up to about 60 V before I could activate the onboard charger. Now all things operate, but don't know the ins and outs of the car. Firstly, when I reverse, the engine shuts down and the car works prefectly on the battery. When I stop, the engine automatically restarts and keeps running. When I drive and accelerate, the turtle comes up. If I immy reduce accelaeration all is ok, if I continue to accelerate, the turtle stays on and the car slows down, requiring a reset before I can use it normally. Any info for me, please? I am really interested to get this thing working properly again. Secondly, the MFD only has a backlight. No display. Help!
 
Welcome!
Levi471 said:
Firstly, when I reverse, the engine shuts down and the car works prefectly on the battery.
That is perfectly normal. It can be a big problem when the battery is empty or severely defective, because the car is then totally unable to reverse.
When I stop, the engine automatically restarts and keeps running.
That should only happen if the HV battery needs additional charging, or if the ICE is still too cold, or if the air-conditioner is running. Once the car is warmed up and the battery charged enough for the liking of the ECU, the ICE should stop. However, there is an as yet unexplained aberrant behaviour of some NHW10's. They do not turn their ICE off when stopping at lights when starting out with a cold ICE, even once the ICE has warmed up. If the ignition is turned off and back on once the ICE is warm, then the ICE will auto-stop at traffic lights.
When I drive and accelerate, the turtle comes up. If I immy reduce accelaeration all is ok, if I continue to accelerate, the turtle stays on and the car slows down, requiring a reset before I can use it normally.
That is difficult to diagnose even if the MFD works. Have you done the MAF sensor cleaning https://www.endless-sphere.com/forums/viewtopic.php?f=14&t=12764#p211975 and other servicing ? https://www.endless-sphere.com/forums/viewtopic.php?f=14&t=12764#p211974
Any info for me, please? I am really interested to get this thing working properly again. Secondly, the MFD only has a backlight. No display. Help!

Maybe you can get a used MFD from the wreckers? The MFD is not essential, but helpful in some situations.

Check out the thousands of posts about this car in the yahoo group at http://autos.groups.yahoo.com/group/Mk1_Prius/

The search function is a dogs breakfast and pictures cannot be integrated into posts etc, like apparently with all Yahoo groups. But it is the best source for information about this car (in English).
 
Attached is a vastly improved version of the English S2000 NHW10 Menu structure.

Again, it is really a .mmap file, NOT a PDF file.

I renamed it to S2000 scanner menus 2010-12-24 public.mmap.pdf to get it past the forum software.

Download, then RENAME it by deleting just the last few letters so that the name is again the proper name: S2000 scanner menus 2010-12-24 public.mmap

Then open it with the free viewer software available at http://www.issusa.com/page5753554.aspx

Main improvements include much more detailed description of the 169 items in the 3.2.1 ECU DATA MONITORING:MONITOR section, including identification of two "Turtle Counters".

There are many other improvements but also many incomplete and incorrect parts. It is a work in progress and there are multiple markers and notes for my own attention to be used while trying to figure out this scanner.

I am quite convinced that even people without this scanner can
A) contribute to the deciphering/translating/explaining of many of the menus, particularly those related to airbags, ABS, fuel injection, ignition timing etc. which will be quite easy to translate for someone who understands the subject matter of the menu. Many of the Japanese menu lines concerned with these contain Roman letters and Arabic numbers that will make it obvious to someone who understands how these systems work and how they look on an English OBDII compliant scanner.

B) learn a lot about how the hybrid system works and how Toyota achieve long NiMH battery life, simply by looking at what they are monitoring/measuring.

Of course, if you come across any insights, please share!
 

Attachments

  • S2000 scanner menus 2010-12-24 public.mmap.pdf
    6.2 MB · Views: 252
Hi guys

Would anyone have a English translation and break down of the NHW11 card for the s2000?

Thanks
David
 
Back
Top