serious_sam said:
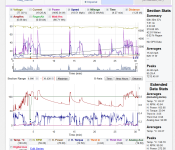
I would say that there's a slight problem with your temperature channel. Normally you wouldn't see such sharp dips in the temperature data.
Forgot to ask, how are you venting the hub in order to maintain ambient pressure internally ?
I think it is the speed of the sensor. You do not see alot. The screenshot is scaled. To a large graduation.
Logrithmically you can zoom in and the traces flatten and you see the peaks more and less transitioning instead of abrupt spikes to higher/lower valleys and plateaus. Time scale.
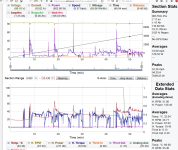
Also, The CA analogger software tries to fit many ( data sets) into one graph.. so the scale is apropriate for the highest in the ( field of ) inputs... so if the human power is 400w peak, but the temp is 200 C peak... and the graph is showing both in say a 1-min frame ( 10 graduations of 6 sec ea) the graph software will revert to the "400" for the highest range of data values. Then the temp scale of 200 * max may change its profile ziggy or flatter because it must share the graph.
In the temperature trace ( that I wish the CA3 accepted two of, and can easily log two of I think, and logged two, but that is another discussion) there is two " bell curves " so to speak, using the lingo of the day. The at rest temp curve, and the on throttle temp curve. We know I am running a 3Kw controller on a 1Kw hub.. anything > 20 A is making excess heat and the temp rises fast. It is on throttle, always on amps.
If you notice, the upper one is always going up, and the lower one is always going down... unless PID amp limited by the temp input sensor control loop.... then you get a nice ( mr. max power? ) flat maximum amps derived from the temp input. Set based on CA3 PROM.
The lower "bellcurve" in the same "trace" is the "at rest and coast" temp.... The KTY sensor is silly fast and is certainly only restricted to the speed of the CA3 processor cycle or whatever. The sensor has been acuratly calibrated at more than one control temperature.
I do not know though, this is my assumption. I checked all data 100+ times for a week whenever I get any data set in to something readable, for the accuracy of the data is what shows anomalies and whatnot. I did it may times, making sure the math for the KTY sensor was right and the voltage was accurate and the other inputs from sensor work were not inflicting conflicts. The CA data out stream is slow... 10hz? Slow. There are specific settingst to go over to ensure the data is accurate.
plus after a while it looks accurate, works accurately, rolls back, ect. The shunt is presumably accurate, the system has has its share of wrinkles to iron out but has worked well for me through some good time.
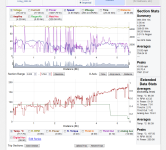
I would love to see just one other persons Analogger data screenshot so we can compare how the data trace is shown on the software. ( I need to find better software or use a better datalogger somehow... )
Oh wait that exists. Here. on the sphere I am sure others have data, and
https://www.ebikes.ca/tools/trip-analyzer.html There is an example data set, ( Justin's Seattle Ride) but is set to 1Hz ( I think) and you can see the temp trace, manipulate the graph scale, tick and untick certain fields, to accentuate the data set you want to focus upon. His temp sensor on that ( low powered, probably properly set up) also exhibits such drops and zig-zags from time to time also. Play with the data, you can zoomin and tick/untick things there.
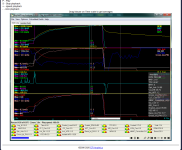
I been datalogging for many years.. just not ebikes for that long. I would die for a good ( better ) data set, or the knowledge to know what to do with it. Something like "Megalogviewer" .. Honestly the data that the CA3 streams is more like kids playing in a sandbox: kiddies play.... compared to what is real data acquisition, in my opinion. MSEFI boards are cheap enough and can datalog a living truckload of data. I know them. I am an impromptu mechanic in my spare time: lots of work when I can fixxin automobiles. Im good at it. I know how the voltages work somewhat I hope.
I so wish the CA3 could output something like this (data set). 16 different inputs playback and scalable 4 at a time. Plus the 40 extra math derived data traces possible. Oh well.
If anyone knows any other data collection and easy to use software system, by all means let me know. I would love to get into it.
The hub is not vented, and has not leaked, like I said, mechanic. I presume it will work its way back the wire case eventually, but the (p-V) pressure and volume is not that great, of both the sealed hub and the volume of ATF inside of it. I can make good more power, and even the climate has warmed up since the hub cooked the halls and was repaired. Anaerobic gasket maker is the bees knees. I am sure if the hydrolic volume was so much that the increase in volume ( of the ATF) would push through the seals and flanges in short order if there was any significant increases. I havnt ad a problem and even expected some, and sourched a few check valves and other little nicknacks, to purge, or vent the volume of vapor out the hub upon increase of temp.
It is only 100 mL. I convince myself I had to do it anyway, for I did not want the bare hub to rust now that I had opened it, you know. Lol. Curiosity killed the cat, right?

")