• Hello ES! We could use some help to get us past the finish line on building the new knowledgebase for the forum.
    Can you donate? Please see our fundraising page. Thank you!

Li-ion cells cycle ageing

Excellent work docware!

But as you know me :wink: , I have again one remark to the cell surface temperature profile graph. I think it would be helpful, particularly for newbies interested in this topic to add a legend (some graphical delimiter) where is in the graph located: charge / rest time / discharge / and again rest time step.
 
Thanks for sharing all that great info. I looked at the thread just in time, because silly me was actually considering building an 18650 pack for my son's ebike. Now I'm going with my original plan which includes having to do a bit of cutting on the Phazor frame to make room for automotive grade cells.
 
Pajda said:
Excellent work docware!

But as you know me :wink: , I have again one remark to the cell surface temperature profile graph. I think it would be helpful, particularly for newbies interested in this topic to add a legend (some graphical delimiter) where is in the graph located: charge / rest time / discharge / and again rest time step.

Something like that ?

Panasonic PF cycling temperatures.jpg
 
New pair of cells started cycling test, SONY VTC6 and Samsung 21700 50E.

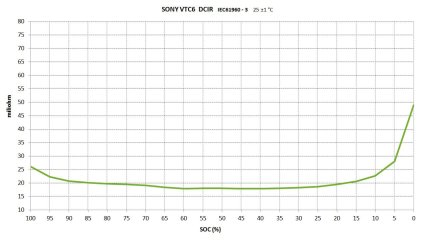
SONY VTC 6 is running with parameters charge 1A / 0,1 cut off to 4,1 V, discharge 2,5 A to 3,3 V. SONY VTC6 was chosen because it is an interesting cell in the high power category, moreover until now there wasn´t any SONY representative in the test.

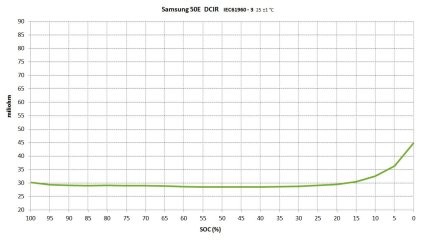
Samsung 21700 50E is another new cell in the test. Running at increased parameters charge 1,5 A / 0,1 A cut off to 4,1 V, discharge 3,75 A to 3,4 V. Both resting times increased from 5 to 10 minutes for 50E. This cell was chosen as a promising member of small 21700 family (based on Pajda´s positive evaluation).

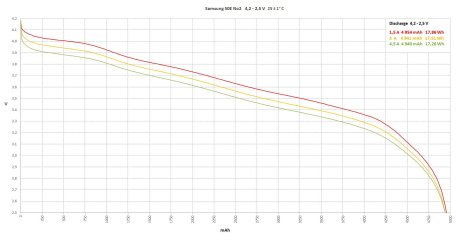
Graphic characterization of the cells :

SONY VTC6 No1  4,2 - 2,5 V.jpg
SONY VTC6 DCIR.jpg
Samsung 50E No2   4,2 - 2,5 V.jpg
Samsung 50E DCIR.jpg
 
My understanding is, Samsung 50E is LCO, aka LiCo, lithium cobalt oxide, LiCoO2

and Sony / Murata VTC6 is NMC aka NCM, nickel manganese cobalt, LiNiMnCoO2

sometimes these labelled in other mfg model naming conventions as "INR" as with LG's M36

The latter chemistry is supposed to have higher energy density than the former, as a generalization, not sure if meant to be by volume or weight.

Obviously volumes differ by a lot, but the Sony is much lighter, 46.6g vs 69g for the 50E, so 64 mAh/g vs 72 mAh/g respectively, that gap closes a fair bit.

 
are the cycling C-rates and LVC supposed to be "relatively standardized", and how so?

otherwise longevities wouldn't be comparable, right?
 
john61ct said:
My understanding is, Samsung 50E is LCO, aka LiCo, lithium cobalt oxide, LiCoO2

Samsung INR21700-50E seems to be NCA-C/Si chemistry cell due to this MSDS https://1dab84c2c05103a7b0db-1e1d21c2e54e342f67cb520004adde98.ssl.cf2.rackcdn.com/MSDS/KLARUS-21GT-50-Ver2-MSDS.pdf I think that there are already available very few HE cells with LCO chemistry in the market.
 
Pajda said:
Samsung INR21700-50E seems to be NCA-C/Si chemistry cell due to this MSDS
Wow good find, thanks!

This seller claims they're NMC https://www.batteryjunction.com/samsung-50e-inr-21700-li-ion-battery.html

and then provides a link to the same MSDS
https://sep.yimg.com/ty/cdn/theshorelinemarket/SAMSUNG-50E-21700-MSDS.pdf

 
john61ct said:
are the cycling C-rates and LVC supposed to be "relatively standardized", and how so?

otherwise longevities wouldn't be comparable, right?

Volume proportion of 21700 to 18650 is 1,46 x. We can build 20 Ah battery with 4p high capacity 21700 cells or 6p high capacity 18650 cells. That is 1,5 ratio. Therefore I have chosen 1,5 A charge and 3,75 A discharge currents for 21700 to compare apples to apples.

I continue using LVC 3,4 V for high capacity cells for 21700 also. Frankly, LVC should be determined individually for each cell to draw the same capacity or rather energy, which I thinked to the end little bit late.
 
Well since these chemistries have such similar mapping of resting V to SoC, I would have gone with a standard LVC across the board, except of course for LFP and LTO.

But, they're your tests of course, and the actual usable energy contained between 3.4V and 3.4V in either case would be miniscule,

so a close to moot point.

The charge / discharge rates I would have done at a standard C-rate against rated capacity, not really clear what the volume ratio accomplishes?

But again, your tests and this nit picking is 5000% overshadowed by my gratitude for all y'all's doing these tests.
 
Well, I´ll try to explain. Let´s say I want to build new battery 48 V. I am limited by size and weight because nobody want to have big and heavy battery on the bike. So that maximum acceptable solution is let´s say 13s6p of 18650 cells. Or 13s4p of 21700 cells.

Now it´s up to me what cells I decide to choose. However, during using of the battery I will draw the same amount of capacity (or rather energy) from the cells, independently of the cell choice.
Is it understandable what and why I am trying to test ?
 
Hmm.

I think then attempting to calculate the actual energy densities (weight & volume separately) and publishing those as supplementary info for each cell type would inform those for whom it is critical.

The "actual maximum C-rate" spec would then give a real-world power density point of comparison.

But longevity cycle testing is IMO a very critical factor, completely orthogonal to all those others

so IMO (usual your tests / humble gratitude / not my place disclaimers)

it would be better for both DoD and C-rates to be consistent

to really get apples to apples on cycle lifespan tests
 
Just now I have energy density data only for M36 and 50E.

LG M36 .................... 250 Wh/kg, 694 Wh/l at 1 A discharge
Samsung 21700 50E ..... 258 Wh/kg, 722 Wh/l at 1,5 A discharge
 
M36 I also had down as NMC, but a technical German site says it's NCA / LiNiCoAlO2 as well
 
Thanks for your effort. Nice to see that LG perform so good.
What about doing another test with M36 or MJ1 between 4,2 and 3V? I would like to see what happens then with cycle life.

eMark said:
Is it possible that the Samsung 30Q (LNM) actually has decent-to-good cycle life longevity when it's ebiking application isn't for raw performance like that of power tools and vaping?
I don't use 30Q any longer because there seems to be an issue with varying self discharge.
 
madin88 said:
I don't use 30Q any longer because there seems to be an issue with varying self discharge.
Yes, aware of that heresay ... sooo welcoming a worthwhile challenge had decided to build a DIY Vruzend 10S5P battery with 30Q cells to track cycle life longevity and any self discharge. FWIW the new 30Q cells are 141 not 138. Will keep a close eye on any resting self-discharge and will send you a PM, if and when it becomes evident that it's still an obvious problem. Hopefully, you won't hear from me until i post my findings (one way or the other) on that same thread sometime in June.

More likely wait until this summer (fair time trial) to report if my newer 141 cells definitely have similar self discharge tendency. IMO, Samsung has a similar zero tolerance for defects as does Japan (Panasonic/Sanyo). Would prefer to believe that whatever the previous 30Q problem (e.g. QC, re-engineering) my 10S5P 30Q battery (with 141 cells) won't suffer from the same problem.

You can read my recent 30Q post currently second up from last post on this thread ... https://endless-sphere.com/forums/viewtopic.php?f=14&t=104286&start=25 ... If and when i'm convinced there's a similar self-discharge problem with my 10S5P 30Q battery will post again on same thread. Could be immediately or months before enuf tracking info ... one way or the other. If the same problem still exists with my 10S5P 30Q 141 cells ... it should become evident, but possibly not immediately.
 
madin88 said:
What about doing another test with M36 or MJ1 between 4,2 and 3V? I would like to see what happens then with cycle life.

Knowing that MJ1 and M36 were doing well at Pajda´s 100 % DOD 1C disch. testing, we can be sure that 4,2 – 3 V cycling would be also OK.
 
eMark said:
Yes, aware of that heresay ... sooo welcoming a worthwhile challenge had decided to build a DIY Vruzend 10S5P battery with 30Q cells to track cycle life longevity and any self discharge. FWIW the new 30Q cells are 141 not 138. Will keep a close eye on any resting self-discharge and will send you a PM, if and when it becomes evident that it's still an obvious problem. Hopefully, you won't hear from me until i post my findings (one way or the other) on that same thread sometime in June.
Thanks for the news and for sharing your results. Lets hope the "141 batch" is better and that you do not have troubles with the new packs.

I was measuring voltage every 3 days. It was a 20s pack with BMS disconnected (to exclude potential errors with it).
What i found out is that some groups did self discharge pretty quick down to a given voltage (4V or so) and then it went much slower.
The overall drift was 0,4V after 2 years and 100cylces with balancing BMS! and around half the groups were fine (had same voltage) where the others had been somewhere between.
 
From 4.05 to 4.2V termination point is I understand not significant actual usable mAh capacity, just "surface charge".

Maybe even 4.00?

So perhaps not just better for longevity, but fewer balancing issues, to just set the 30Q stop-charge point lower for normal usage charging. . .
 
john61ct said:
From 4.05 to 4.2V termination point is I understand not significant actual usable mAh capacity, just "surface charge".
Maybe even 4.00?

No, no, there is a LOT capacity between 4,0 and 4,1 V. I mean resting voltage. It´s obvious from SOC chart as well from discharge graphs. So optimal charging voltage to exploit capacity may be about 4,12 - 4,15 V (termination point).

SOC% versus voltage  14.1.2020.jpg
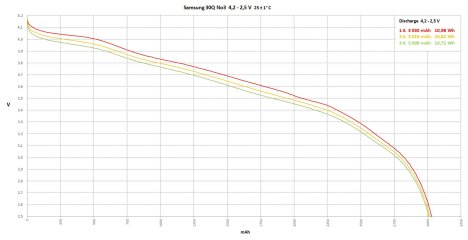
Samsung 30Q.jpg
Samsung 50E No2   4,2 - 2,5 V.jpg
 
docware said:
john61ct said:
From 4.05 to 4.2V termination point is I understand not significant actual usable mAh capacity, just "surface charge".
Maybe even 4.00?
No, no, there is a LOT capacity between 4,0 and 4,1 V. I mean resting voltage.

So optimal charging voltage to exploit capacity may be about 4,12 - 4,15 V (termination point)
Note not disputing here, just asking, all my experience is with LFP not these LI chemistries.

I did not mean resting V, but the CV setpoint, termination voltage. Obviously how long CV stage is held, as charging current is falling, will impact actual capacity utilization also.

After getting to the ""full point" however defined, if you then remove 0.5% of rated capacity, that "top resting" voltage might drop, to a more standardized number, surface charge delta being more affected by the charger trying to push those last few mAh at the end.

A smaller proportion of that "input energy" is actually getting usefully stored the higher / longer you go.

So, did you compile that SoC vs resting chart yourself?

Was the SoC data derived from counting coulombs? On the way in or out?

In testing much larger cells, I've found that precisely timed CC load tests are much more accurate in measuring capacity utilization deltas from differing charge setpoints, coulomb counting less so, highly variable depending on the coulometer used.

In any case, I personally reckon gaining longevity and reducing imbalance issues is worth sacrificing some capacity utilization, and think maybe there lies a way to ameliorate the perceived 30Q problems, along with some reduced expectations.
 
I assume charging just in time - before ride. Factors affecting degradation are temperature, voltage and ….. time spent on the high voltage. So optimizing charging procedure is very easy and simple solution how to avoid cells degradation during sitting at the high voltage. And still be able to utilize max capacity.

SOC chart – have to repeat : take please the chart as informative only, especially SOC low end.
I missed any meaningful data on the relationship SOC versus voltage, therefore I started my measurement. Take please this table as a first version only, I am still only collecting data, information, experiences and ideas for an improvement here. There are many variables in play here. But it is still better than no data.
Each cell was individually measured first to get exact capacity at 1 and 2 amp, than discharged from 100 to 0 % in twenty steps. Each step represents 5 % capacity, discharge current 2 A.

Equipment employed : electronic load Maynuo M9712, DMM GW Instek GDM-8351, thermometer Omega HH 520, ZKETECH EBC-X510 for charging (see first page of this thread).

Here is one typical chart :

LG MJ1 SOC mapping 2A 292 s pulses.jpg
 
Great stuff, thanks.

wrt that specific topic "surface charge", doing the same type of test, but just in that top 100-95% segment, say in 0.2% capacity increments would be very informative.

Yes of course minimizing time spent there reduces the lifetime cycle penalty of "going too high".

But if the only benefit of going there at all, is say 2-3% actual increased capacity, personally I'd use profiles that stayed below that top shoulder.

With LFP prismatics and minimal CV Absorb time, a 3.45V charge profile gets to within 2-3% of the same point as 3.65V, depending on C-rate.

With a low discharge use case, such coddling can help get to 10,000 cycles rather than settling for the usual 2-3,000, which with banks costing thousands means a much cheaper running cost than even the cheapest lead-based storage.

Sorry for the tangent, just clarifying why of interest to me, I realize OT. . .
 
docware said:
... there is a LOT capacity between 4.0 and 4.1 V.
It seemed to take longer bulk charging my 10S5P 30Q battery (with 2.5A charger) from 4.00V to a 4.10V than say from 3.40V to 3.50V? The resting voltage of the new 30Q 141 cells shipped from IMR in November was 3.40V.

When you say there's a LOT of capacity between 4.0V to 4.1V is it more about the increase in stored energy at a higher voltage than any increase in the resting stored mAh capacity between 4.0V to 4.1V than the resting stored capacity between 3.40V to 3.50V ?

Would you recommend that i always use the MeanWell 1.45A (adjustable cut-off voltage set at 4.0V) for bulk charging whenever first bottom balance charging (as necessary) instead of the 2.5A (adjustable cut-off voltage set at 4.0V) for bulk charging from the Get GO[ ... time permitting before top balance charging from 4.00V to 4.06V ?
 
Back
Top