Samsung INR18650-25R cycle test.

TheBeastie said:
This is why I am a fan of a overly parallel-yfied P build pack, you get more total cycles (and less sag) compared to a thinner P setup that torture your cells to early death.
It certainly will give a much longer useful battery life,...but the trade off is obviously extra weight.
Effectively , you are admitting the cells do not have the energy density/cycle life you need !
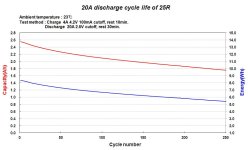
I would like to see a comparison graph for a 20amp discharge using a 3.1v cut off ?.....just to know for certain what effect pushing down into that 2.5 v level has.
 
I thought I had already mapped the Samsung INR18650-25R.
Copied results over from my Capacity Mapping (Optimal Charge-Discharge Voltages) thread.


DrkAngel said:
file.php


Using graph I built a discharge map.
(Based on .2A <.1C discharge rate line)
Scaled in Wh rather than my typical mAh ... sorry.

In "Paint" I "enlarged", added .05V lines, "scaled" 1/10th increments to 0 to 1, copied and pasted and dragged to carefully measure discharge line intersections with various voltage increments.

2.80 = .04
2.85 = .04
2.90 = .04
2.95 = .05
3.00 = .07
3.05 = .07
3.10 = .08
3.15 = .08
3.20 = .07
3.25 = .07
3.30 = <.1
3.35 = .1
3.40 =.1
3.45 = .45
3.50 = .4
3.55 = .4
3.60 = .7
3.65 = .85
3.70 = .6
3.75 = .55
3.80 = .35
3.85 = .5
3.90 = .5
3.95 = .6
4.00 = .35
4.05 = .4
4.10 = 1.0
4.15 = .3
4.20 = <.1wh

Bar graph would be more accurate, actual capacity would be a horizontal line to the lower .05V.


file.php


Shows good capacity from 3.40V till initial sag below 4.20V.
Displays similar hills and valleys to various other of my "mapped" LiPo.

IN|R18650-25 Capacity Bar Graph from .2A discharge graph

file.php


Between 3.40V and 4.10V appears optimal for best usable capacity with least "wear and tear" ... IMO ...

Capacity map point from 4.20V to 4.15V would be higher than "mapped", due to the "natural" voltage sag from static to discharge voltage.
The 4.10V - 4.15V, at this very low discharge rate, should be reasonably accurate.
The massive bulge of capacity from 4.05V - 4.10V is very common, typical of many Lipo cells I've mapped and should be considered accurate.
This indicates ≥4.10V as optimal charge point, the OPs 4.15V looks to be reasonably optimal!
Based on the OPs 1C discharge, compared to the multiple discharge rate graph, I would advise 3.30V as the optimal 1C discharge point for maximum capacity vs life!
 
All other factors being equal...
discharge-charge rates are a major factor in capacity degradation.

E.G. C rate is a major and progressive factor in battery deterioration!

file.php

Deterioration to 80% of original capacity:
3C produces < 50 cycles
2C produces ~ 250 cycles
1C produces ~ 500 cycles
High C rate discharges (and charges) are progressively damaging and as actual capacity declines, deterioration accelerates rapidly!
 
Interesting info DA..
What cell/ chemistry was that for ?
But It's always irritating when the test changes more than one variable at a time ( charge and discharge !)
I guess I need to get a few cells and start testing ! :wink:
 
DrkAngel said:
All other factors being equal...
discharge-charge rates are a major factor in capacity degradation.

E.G. C rate is a major and progressive factor in battery deterioration!

file.php

Deterioration to 80% of original capacity:
3C produces < 50 cycles
2C produces ~ 250 cycles
1C produces ~ 500 cycles
High C rate discharges (and charges) are progressively damaging and as actual capacity declines, deterioration accelerates rapidly!
Hard to tell when there are no temperature graphs. Possibly it also correlates with higher temperature at higher rates.
 
Updated and enhanced ...
 

Attachments

  • Cycle Life vs Capacity.jpg
    Cycle Life vs Capacity.jpg
    56.4 KB · Views: 2,968
Pimped out the present info ...
 
DrkAngel said:
Optimal discharge depth looks to be 3.30V at a 1C discharge rate.
This likely relates to a ~3.40V static voltage (After discharge removed)

file.php

EDIT:
80ºC @ [strike]3C[/strike] 6 C discharge? HOT!
 
INR18650 - 25R, according to graph, hit 80ºC at a 15A (6C) discharge rate.
20A discharge (8C) I graphed OPs test against, hits near 100ºC - (Yes, you can cook on the battery pack)

Let me post up the INR18650 - 25R 20A discharge cycle life graph from Samsung:

file.php


While battery is 20A capable, for multiple (obvious?) reasons, I would not recommend it for more than brief moments!
 

Attachments

  • INR18650 - 25R (20A).jpg
    INR18650 - 25R (20A).jpg
    60.7 KB · Views: 1,620
Updated multi-graph and added feasible projected capacity lines through 500 cycles.

file.php
 

Attachments

  • Cycle Life vs Capacity w projected.jpg
    Cycle Life vs Capacity w projected.jpg
    84.5 KB · Views: 1,625
electricbike said:
What parameters do you want me to change in my next INR18650-25 test?
I think i will do a 2C discharge.

To simulate aggressive riding and regen, can you do this?
-Discharge 4C 10s
-Charge 2C 10s
Measure temperature all the way.
 
h0tr0d said:
electricbike said:
What parameters do you want me to change in my next INR18650-25 test?
I think i will do a 2C discharge.

To simulate aggressive riding and regen, can you do this?
-Discharge 4C 10s
-Charge 2C 10s
Measure temperature all the way.
100A discharge likely exceeds capabilities.
Single cell at 4C continuous discharge = 60ºC (140ºF) accumulated temperature (unknown if occasional 2C charge will reduce or increase thermal path?)
Building a combined pack is liable to greatly amplify temperature.
Active cooling is highly recommended to avoid damage and danger! (Bonus of better efficiency and extended life?)
 
Due to the noticeable disparity between your test capacity and that of the manufacturer ...
I would like to see a few capacity control-comparison tests,
4.20V >>> 2.50V @ 2.5A (Similar to OEM test voltage)
4.20V >>> 3.10V @ 2.5A (Your test voltage +OEM high)
4.15V >>> 3.10V @ 2.5A (Your test voltage, as control)
4.15V >>> 2.50V @ 2.5A (Your test voltage + OEM low)
4.10V >>> 3.30V @ 2.5A (My derived optimal 1C C\D rate)

Run each test singly on each of 5 cells (5 cell x 5 tests = 25 single tests total)
  • This should help determine:
  • additional capacity at each voltage area
  • If capacity difference is due to:
    discharge device
    individual cell
    voltage range

For a full test ...
I would like to see a full run of my derived optimal C\D voltage for 2.5A (1C) of ...
4.10V >> 3.30V @ 2.5A

Your 4.15V to 3.1V @ 2.5A (1C) displays excellent life preservation-extension ... but more is better!
 
h0tr0d said:
electricbike said:
What parameters do you want me to change in my next INR18650-25 test?
I think i will do a 2C discharge.

To simulate aggressive riding and regen, can you do this?
-Discharge 4C 10s
-Charge 2C 10s
Measure temperature all the way.

In cycle mode the Reaktor can only charge/discharge at the same current and minimum wait time is 1 min so
no, can't do that sorry.
 
DrkAngel said:
Due to the noticeable disparity between your test capacity and that of the manufacturer ...
I would like to see a few capacity control-comparison tests,
4.20V >>> 2.50V @ 2.5A (Similar to OEM test voltage)
4.20V >>> 3.10V @ 2.5A (Your test voltage +OEM high)
4.15V >>> 3.10V @ 2.5A (Your test voltage, as control)
4.15V >>> 2.50V @ 2.5A (Your test voltage + OEM low)
4.10V >>> 3.30V @ 2.5A (My derived optimal 1C C\D rate)

Run each test singly on each of 5 cells (5 cell x 5 tests = 25 single tests total)
  • This should help determine:
  • additional capacity at each voltage area
  • If capacity difference is due to:
    discharge device
    individual cell
    voltage range

For a full test ...
I would like to see a full run of my derived optimal C\D voltage for 2.5A (1C) of ...
4.10V >> 3.30V @ 2.5A

Your 4.15V to 3.1V @ 2.5A (1C) displays excellent life preservation-extension ... but more is better!

Ok, i will start those test when i get my ordered reaktors, maybe a couple of days.
 
electricbike said:
h0tr0d said:
electricbike said:
What parameters do you want me to change in my next INR18650-25 test?
I think i will do a 2C discharge.

To simulate aggressive riding and regen, can you do this?
-Discharge 4C 10s
-Charge 2C 10s
Measure temperature all the way.

In cycle mode the Reaktor can only charge/discharge at the same current and minimum wait time is 1 min so
no, can't do that sorry.

Ok then,
2C charge/discharge, 4.1V - 3.3V?
 
h0tr0d wrote: Ok then,
2C charge/discharge, 4.1V - 3.3V?

Sure, no problem, i will do that when the chargers arrive.
Edit: Actually Samsungs spec say no more than 4A in rapid charge.
 
Back
Top