
DrkAngel
1 GW
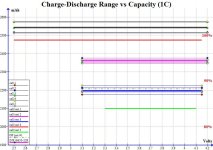
#3 test of 5 in series, completed and charted.
Test1: 4.20V >>> 2.50V @ 2.5A (Similar to OEM test voltage) Done.
Test2: 4.20V >>> 3.10V @ 2.5A (electricbike test voltage +OEM high) Done.
Test3: 4.15V >>> 3.10V @ 2.5A (electricbike test voltage, as control) Done.
Test4: 4.15V >>> 2.50V @ 2.5A (electricbike test voltage + OEM low)
Test5: 4.10V >>> 3.30V @ 2.5A (DrkAngel derived optimal @ 1C C\D rate)
(Cell Test # lines are rough guess - properly positioned at average of tests cells, after each test completed)
")