BVH said:Tracking shows my Satiator as being delivered tomorrow! Very excited! Looking forward to setting up two profiles for my two identical 51.2 nominal, 12 Ah LiFeP04 packs. 1st is a termination of 3.5 Volts per cell and 2nd is 3.65 Volts per cell. I'll execute the 1st profile charge and when finished, will execute the 2nd to see how much additional capacity goes in.
Hi BVH, did you get a chance to do this?
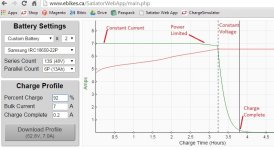
I've attached in the .zip file a set of charge profiles for 10S and 13S lithium packs at 3.90, 3.95, 4.00, 4.05, 4.10 ,4.15, and 4.20 V/cell respectively. These were used these to charge a battery at each subsequent charge level and used the Satiator's displayed amp-hours to see the incremental amount of additional charge in each phase. It takes a little while since it's in the CV charge mode, so each additional top-up charge required a few hours for the current to settle at exactly 0A. Here's what the results look like for an Allcell 20Ah pack with LG cells, and eZee 15Ah pack with Sony cells, and an an internal 10sx3p pack made with Samsung 25R cells.

You can see that even though the cells all have similar nominal voltage range, the actual relationship between voltage and capacity is pretty unique. With the LG cells, the each additional 0.05V results in a 5% increase in the state of charge. With the Sony cells, it's a ~6% increase up to 4.1V/cell, but then going from 4.10-4.15V and from 4.15-4.2V we only have a 3% increase. While with the Samsung 25R cells, going from 4.00V to 4.05V / cell resulted in way more capacity uptake (over 10%) compared to 4.05->4.10V, which only resulted in an additional 3% charge increase.
In the default profiles that ship with the Satiator I somewhat arbitrarily called a 4.05V/cell charge an "80%" charge, but this was pulled from thin air. Now we can see that in reality, charging to 4.05 V/cell results in an 87% charge with the Sony pack, an 85% charge with the LG pack, and a 91% charge on the Samsung 25R pack. If you just want an 80% charge, then 4.00 V/cell is more appropriate.
I was really curious to see how well we could derive this same %SOC vs. charge voltage relationship from the _discharge_ curve of a battery pack, since that is a lot easier to get than charging to discrete voltages, waiting for ages for the current to trickle down, and then recording the incremental Ah that went in at each stage.
In the basic modal of a battery pack, where the cell is assumed to have some voltage based on the state of charge, and a fixed internal resistance, then we have the simple relationship:
Vterminal = V(SOC) - IR.
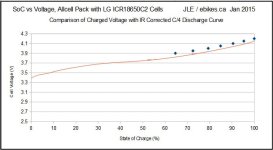
In which case we could get the desired Voltage-SOC relationship by simply accounting for the voltage drop lost to the DC internal resistance [ ie. V(SOC) = Vterminal + IR]. However, when the two data sets are plotted, they don't quite work out that way. Here is the data with the Allcell pack, where we accounted for the internal resistance on the discharge curve with the actual measured pack impedance (0.13 mohms)

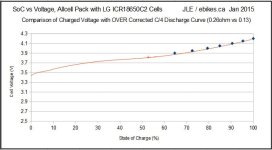
That this says is that if we charge a cell to 3.9V it will be about 65% charged. However, if we discharge the cell to 3.9V, even accounting for the internal resistance (so that might be 3.7V, 3.8V etc. depending on the current draw), it will wind up at around 75% charged. Ideally we would expect the cell to be at the same capacity whether we got there by charging or discharge. But the shape of the curve is still similar, and if I doubled the internal resistance term then it effectively made the discharge curve match up very neatly with the charging points that were measured before

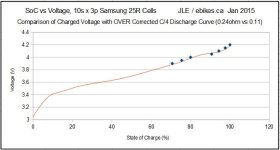
The same trick worked fairly well with the Samsung pack, and you can see that the funky business between 4.0 and 4.05V exist on the discharge curve just like we noticed when charging to these points

The point of the exercise was so that we could provide people with a more accurate figure for determining how much capacity they'll have for different partial charge levels, but what it made clear instead is that this relationship is quite dependent on the exact cells that are used.


