Punx0r said:Tight tolerances in mass-produced assemblies becomes expensive very quickly.
Indeed, already the air gap at ~0.5-0.6mm is about as tight as we'd want things for mechanical and assembly tolerances, and is the source of occasional rubbing and interference. I suppose if you had a super thin precision gap and then used compressed air to make this into a viable air bearing then you could... STOP! The point of this thread is "Definitive Tests on the heating and cooling of hub motors" and not "Endless Banter on the heating and cooling..." (unless of course such idle banter is to suggest trying ferrofluids, in which case
So back to being focused on things that can be tested and the results they show. We've taken a lot of time in the last week getting the wind tunnel and associated measurement equipment revamped so that we can have the testing and analysis be largely automated, and rather than it taking 3-4 days for me to do all the experiments to make a conductivity vs rpm/speed plot, we should be able to get it down to just a few hours.
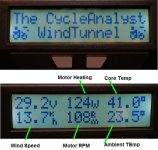
One of the main steps in this effort is to consolidate all of the recorded info into a single data file, rather than a multitude of IR camera images, CA logs, and logs from the BACdoor controller. For this I've repurposed a CA3 with special firmware as our main acquisition device. The PAS input and Speedometer inputs are configured to show the wind speed and motor RPM, while the torque sensor input was converted into a 2nd temperature sensor for measuring ambient. So now this one device is able to record motor watts, motor RPM, motor core temperature, ambient temperature, and wind speed:
Previously to get the shell temperatures I was using an infrared imaging camera, but that makes the data analysis and especially the transient analysis quite tedious since the data is captured as image files rather than numeric. So instead we purchased three MLX90614 discrete IR temperature detectors with a tight 10 degree field of view.
View attachment 2
We have them mounted on magnetic bases so that we can position the sensors to different parts of the shell, including directly on the edge view of the rotor rather than just the side plates as we were doing with the thermal camera. The plan in general would be to have one on the edge, one on the end of the side plate, and another nearer to the center of the side plate.
A small arduino circuit then intercepts the CA data stream and appends the 3 different IR shell temperature readings to the end of each line, so that what finally comes to the computer is a data stream with the motor RPM, motor heat power, the tunnel wind speed, the motor core temperature, the ambient wind temperature, and 3 IR shell temperatures, all primed for easy transient (rather than steady state) analysis.

Previously we weren't actually using an anemometer during the test as we had a correlation of fan RPM vs wind speed, but that doesn't account for the effect of the sample blockage in the test chamber. So I happened on this inexpensive smartphone anemometer at local shop which is designed to plug into a phone's stereo/microphone jack. It has a tiny circuitboard in it to get power from AC signals on the audio output jack for running an optical encoder, and with a bit of hacking of the board it was easy to make it run off DC instead with a DC pulse signal sent straight to the CA.
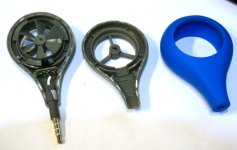
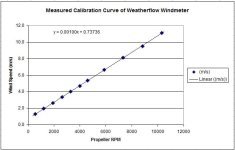
We compared with displayed speed readings that it showed on the phone app with the pulse period of the encoder as measured on an oscilloscope to get the calibration curve that they were using, which is a simple straight line + offset:
